How Donald Trump Changed Pennsylvania’s Electorate: Tracking Voter Registration Trends Over the Past Decade
A Commentary By Nick Field
KEY POINTS FROM THIS ARTICLE
— Pennsylvania changed in the Trump era from being a somewhat Democratic-leaning state to a top presidential battleground, voting for the winning candidate in all 3 of Donald Trump’s elections.
— One indicator of the GOP’s growth in the state is changing voter registration patterns, as Republicans have drastically reduced the Democrats’ voter registration edge in the state in the Trump era.
— All but 3 of the state’s 67 counties have seen the Republicans net registered voters since 2015.
Pennsylvania’s changing voter registration
Way back in the summer of 2016, when I first started to examine Pennsylvania’s voter registration trends, I wrote that “the idea that [Donald Trump] is single-handedly changing PA’s electorate has little support.” At that moment, the evidence seemed to support my assertion. Time, of course, made a fool out of me.
Over the years, I periodically tracked the shift in the margins of the PA numbers, starting with May 2015, right before Trump descended the escalator and launched his campaign. All my updates would examine the revisions since the previous article, and while this method helped illuminate all the microscopic modifications that were taking place statewide, I now worry it caused me to miss the bigger picture.
While there was plenty of movement among the existing group of voters, what I failed to properly appreciate was the influx of registrations that were growing the overall voter pool. For instance, on May 19, 2015, the Pennsylvania numbers were as follows:
3,963,864 Democrats
2,964,437 Republicans
1,104,062 Other
8,032,363 Total
By Jan. 20, 2025, the numbers looked like this:
3,814,026 Democrats
3,622,722 Republicans
1,399,419 Other
8,836,167 Total
Those 803,804 new registrants were the main impetus behind the Democratic advantage dropping from 999,427 to 191,304 over the past nine and a half years.
The county-level changes are shown on Map 1.
Map 1: Change in registration by party, May 2015-January 2025
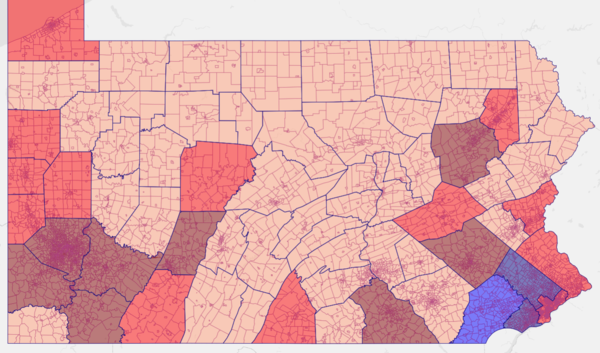
Notes: Key: Navy – D+30,000 or more, Blue – D+15,001 to D+29,999, Light Skyblue – D+1 to D+15,000. Light Salmon – R+1 to R+15,000, Red – R+15,001 to R+29,999, Maroon – R+30,000 or more.
Source: Map by author via Dave’s Redistricting App.
Yet for years I would attribute these shifts to ancestral Democrats—especially in Appalachian areas—who were already voting Republican, but lagging behind on actually changing their registration status. That was undoubtedly still a factor, but in retrospect probably an overrated one. Of course, I wasn’t the only one to fall into this trap, as Dems were excited by initial indications that they could offset this erosion in the Southwest by picking up additional support in the more vote-rich Southeastern portion of the state.
As Democratic Senate leader Chuck Schumer memorably put it on the day Hillary Clinton accepted the 2016 Democratic nomination: “For every blue-collar Democrat we will lose in western PA, we will pick up two, three moderate Republicans in the suburbs of Philadelphia.”
After Election Night 2016, Schumer’s comments were widely derided—then slightly redeemed when Joe Biden rode record suburban support to victory in Pennsylvania and nationwide in 2020—only to once again look ridiculous after Election Night 2024.
To get a sense of the imbalance that developed instead, consider that Democrats have lost their voter registration pluralities in 15 counties since May 2015, eight of which are in the Southwest: Beaver, Cambria, Fayette, Greene, Mercer, Lawrence, Washington, and Westmoreland. The other seven are scattered across the Commonwealth, with Berks (Reading) and Bucks in the Southeast, Carbon and Luzerne (Wilkes-Barre) in the Northeast, and Centre (State College), Clinton, and Elk in Central PA. Conversely, the GOP lost a plurality in just one county, Chester in the Philadelphia suburbs, during this interval.
This dichotomy only increased over the past few years as Republicans started to make notable gains in deep blue and swing purple counties. For instance, Philadelphia saw the GOP pick up a net 28,441 registrants over the last nine and a half years, as Republicans successfully ate into core Democratic support by attracting non-white, non-voters to register and turn out for Donald Trump.
Beyond the City of Brotherly Love, Republicans posted five-digit net gains in crucial counties like Berks, Bucks, Erie, Lackawanna, Lehigh, and Northampton. Even in Allegheny (Pittsburgh), one of the Democrats’ best counties in the Trump Era, the GOP still netted 38,925.
These numbers highlight how Trump’s registration gains were made up of two distinct phases. The initial phase took place during his first campaign, when Trump won over Southwest residents and saw a surge of support in rural areas. In the second phase, which began during the 2020 cycle and continued on into 2024, the Trump campaign targeted traditional non-voters, particularly non-white young men, in cities like Allentown, Bethlehem, Lehigh, Philadelphia, and Wilkes-Barre.
Take, for example, two of the largest shifts outside of the Southwest, in Berks and Luzerne counties. This pair of once-blue counties initially shifted right because of their rural white sections, only for their sizable Hispanic populations to join the movement in recent years.
Overall, Republicans grew their margins in 64 of Pennsylvania’s 67 counties, the exceptions being Chester, Delaware, and Montgomery in the southeast. After considerable Democratic growth in this trio over the past few cycles, however, Kamala Harris seemed to hit a ceiling in all three counties last November.
Considering all of this, it appears that in their bid to maximize their support among wealthy, educated, moderate voters in the suburbs, Democrats focused their messaging almost entirely towards this select group. In the process, the party managed to practically reverse Schumer’s prediction. For every suburban voter Democrats won in the Trump Age, they seemed to lose two or three voters outside of the suburbs.
Altogether, I’m now more convinced than ever of the importance of tracking voter registration numbers. After all, Trump’s non-traditional voters don’t show up in the polls, nor do they tend to donate to Trump, attend his rallies, or watch him on TV. The only place we can seem to find them is on the voting rolls.
With all that said, I now want to dig into the county-by-county margin shifts over this time aided by this new perspective. Typically, I explore PA’s changing voter registration trends by tracking the gains one party accumulated in registrations over the other party. For example, R+500 means that the Republican Party gained a net 500 more registered voters in that county than the Democratic Party did over this period, while D+500 indicates the opposite.
CENTRAL
Blair: R+14,217
Bradford: R+7,180
Cameron: R+845
Centre: R+2,522
Clearfield: R+16,498
Clinton: R+7,317
Columbia: R+9,917
Elk: R+8,508
Huntingdon: R+5,720
Juniata: R+3,798
Lycoming: R+13,481
McKean: R+4,526
Mifflin: R+6,426
Montour: R+1,714
Northumberland: R+13,551
Potter: R+2,720
Snyder: R+3,703
Sullivan: R+1,022
Tioga: R+5,305
Union: R+1,733
Perhaps the only surprising result in this rural region is Centre County’s number, where Penn State University students and professors usually make it the sole blue oasis in a red desert. Despite Harris narrowly winning it by a few points, the GOP overtook Dems in registrations there in the weeks after the 2024 election.
NORTHEAST
Carbon: R+12,795
Lackawanna: R+29,381
Luzerne: R+50,677
Monroe: R+9,833
Pike: R+6,082
Schuylkill: R+22,109
Susquehanna: R+5,543
Wayne: R+6,269
Wyoming: R+3,326
As mentioned above, Luzerne represents one of the PA GOP’s biggest success stories in the Trump Era. Wilkes-Barre is one of Trump’s favorite cities to hold rallies in, as it powered the county’s transformation. Meanwhile, Democrats continue to see their advantage in Lackawanna decline, a slide that not even “Scranton Joe” was able to arrest. Moreover, Carbon and Schuylkill are prime examples of counties where the floor fell out for Democrats once Trump was at the top of the ballot.
NORTHWEST
Clarion: R+6,638
Crawford: R+11,647
Erie: R+27,499
Forest: R+905
Jefferson: R+8,368
Mercer: R+18,868
Venango: R+6,971
Warren: R+5,502
Lakeside Erie County is one of the best bellwethers you can hope to find, supporting the statewide winner in 19 of the last 20 presidential elections (1988 was the sole exception). It’s also an example of a purple county where Republicans could overtake Democrats in registrations within a few years if this current pace continues. If so, it would join fellow northwestern county Mercer, which flipped back in the spring of 2017.
SOUTH CENTRAL
Adams: R+11,670
Bedford: R+9,225
Cumberland: R+1,270
Dauphin: R+1,603
Franklin: R+16,158
Fulton: R+3,332
Lancaster: R+10,497
Lebanon: R+10,047
Perry: R+5,548
York: R+38,604
Cumberland is the perfect example of the type of suburban, white-collar county that Democrats expected to win over in the Trump Era. In fact, Democrats Tom Wolf and Josh Shapiro did both win Cumberland in their 2018 and 2022 gubernatorial races. Despite some improvement, however, no Democratic presidential nominee was able to beat Donald Trump here. They couldn’t even net any registration gains in Cumberland, or across the river in Dauphin County, home to the capital city of Harrisburg. All the while, York continued to be the Big Red Machine for the PA GOP.
SOUTHEAST
Berks: R+35,654
Bucks: R+21,608
Chester: D+27,121
Delaware: D+48,633
Lehigh: R+13,494
Montgomery: D+45,254
Northampton: R+18,579
Philadelphia: R+28,441
The one spot Democrats were actually able to gain registrations over this time was here in Chester, Delaware, and Montgomery. Nevertheless, the 121,008 registrants that the party gained there was nearly erased just by the 117,776 registrants that Republicans picked up from the other counties listed in this Southeast region. Furthermore, in some cases, shifts in the registration numbers were predictive of the November results. In Bucks County, for instance, GOP registrants overtaking Democrats back in July was an early warning sign that Trump would become the first Republican presidential nominee to win Bucks since 1988.
SOUTHWEST
Allegheny: R+38,925
Armstrong: R+13,183
Beaver: R+28,650
Butler: R+22,251
Cambria: R+35,472
Fayette: R+37,349
Greene: R+10,585
Indiana: R+13,510
Lawrence: R+16,941
Somerset: R+15,921
Washington: R+39,216
Westmoreland: R+68,282
These are the sort of numbers that got me so obsessed with ancestral Appalachian Democrats in the first place. Westmoreland is far out in the lead on the rightward shift in Southwest PA, with Beaver, Cambria, Fayette, Greene, Lawrence, and Washington all providing major contributions as well. On top of that, after almost a decade, these shifts are still going strong. Even in counties where the total population is down, more voters are registered in these areas now than there were nine and a half years ago. More than anything, that reality is a true testament of Donald Trump’s ability to change this electorate.
Conclusion
So we can see that while voter registration can’t simply tell us who will win—after all, Democrats still retain a 191,304 advantage in registration, even while Trump won the state by 120,266 votes—it can provide an illuminating window into trends and turnout. Recently, for instance, analyst Michael Pruser found that in 2024 registered Republicans outvoted registered Democrats in an even-year general election for the first time in Pennsylvania’s history. Therefore, at this moment, voter registration appears to be the best tool we have to track a changing electorate.
Nick Field is a Decision Desk HQ contributor and correspondent for the Pennsylvania Capital-Star. He is a former Managing Editor of PoliticsPA, whose expertise has been cited by NBC News, Vox, KYW Newsradio and WESA.
See Other Political Commentary.
Views expressed in this column are those of the author, not those of Rasmussen Reports. Comments about this content should be directed to the author or syndicate.
Rasmussen Reports is a media company specializing in the collection, publication and distribution of public opinion information.
We conduct public opinion polls on a variety of topics to inform our audience on events in the news and other topics of interest. To ensure editorial control and independence, we pay for the polls ourselves and generate revenue through the sale of subscriptions, sponsorships, and advertising. Nightly polling on politics, business and lifestyle topics provides the content to update the Rasmussen Reports web site many times each day. If it's in the news, it's in our polls. Additionally, the data drives a daily update newsletter and various media outlets across the country.
Some information, including the Rasmussen Reports daily Presidential Tracking Poll and commentaries are available for free to the general public. Subscriptions are available for $4.95 a month or 34.95 a year that provide subscribers with exclusive access to more than 20 stories per week on upcoming elections, consumer confidence, and issues that affect us all. For those who are really into the numbers, Platinum Members can review demographic crosstabs and a full history of our data.
To learn more about our methodology, click here.