What Is a Wave in the Senate?
A Commentary By Larry J. Sabato, Kyle Kondik and Geoffrey Skelley
Defining the undefinable as Republican chances inch upward
For several months, we’ve held steady on our range of expected gains for Republicans in the Senate: a net of four to eight seats. With Labor Day in the rearview mirror and with less than 55 days to go until the midterms, we’re giving Republicans a slight bump: Our new range is a Republican net of five to eight Senate seats.
This means that the best-case scenario we can now envision for Democrats is a 50-50 tie in the Senate, with Vice President Joe Biden’s tiebreaking vote narrowly keeping Sen. Harry Reid (D-NV) as majority leader.
The likeliest outcome remains a Republican gain of six or seven seats, which we noted before Labor Day and stand by now. That would be good for a narrow 51-49 or 52-48 Republican Senate majority.
What’s changed? Not a whole lot: It’s just that the weight of an unpopular president in the White House and a GOP-leaning Senate map is subtly moving things a tick or two in the Republican direction.
We do have one major rating change this week: Arkansas is going from Toss-up to Leans Republican. We had Sen. Mark Pryor (D-AR) as an underdog earlier this cycle, and we’re putting him back there now based on the growing weight of polling data. If one assumes Republicans will net Montana, South Dakota, and West Virginia, they need at least two more seats to meet the low end of our range. Arkansas looks like the next domino to fall, and if that comes to pass, the GOP will have netted four seats. (More on this in our race-by-race analysis below.) Given the wide range of other targets for Republicans in the Senate — Alaska, Colorado, Iowa, Louisiana, and North Carolina, with other conceivable but more remote possibilities in Michigan, Minnesota, and New Hampshire — it seems reasonable to expect that the GOP will net at least one more assuming they don’t lose any of their current seats. Hence the new range.
Given that Republicans are poised, we believe, for substantial Senate gains, we’re wondering: What would count as a “wave” for the GOP in the Senate?
As emeritus Prof. Al Tuchfarber of the University of Cincinnati wrote in the Crystal Ball last week, waves have a “very specific semi-formal definition” from a political science standpoint, which is that one party or the other nets 20 or more seats in the House. By that definition, the GOP is likely to fall short this year, if only because they are close to being maxed out in the House. (We project the Republicans to gain five to eight House seats, coincidentally identical to the new Senate projection.)
But there’s no wave definition for the Senate, probably because the Senate is so idiosyncratic: Only a third of the seats are up every two years, and each class alternates between being contested in bigger-turnout presidential years and smaller-turnout midterm years.
Jacob Smith, a political science graduate student at the University of North Carolina, has an interesting take on this. In his senior honors thesis for Kenyon College, he researched the idea of a wave election and came up with this definition: A wave year is “a congressional election that produces the potential for a political party to significantly affect the political status quo as the result of a substantial increase in seats for that party.” (We encourage readers to read his deeper explanation.)
By his calculation, Smith argues that a six-seat gain for the GOP in the Senate (likelier than not, and Smith freely admits that defining waves in a standard way in the Senate is quite challenging) and a 26-seat gain in the House (not very likely) would make 2014 a wave year. Previous wave years by this definition since World War II are: 1946, 1948, 1958, 1964, 1966, 1974, 1980, 1994, 2006, and 2010.
Note that 1986, a year when Democrats gained eight Senate seats and five House seats, is not included here. We’ve often compared 1986 to 2014; in 1986 President Reagan had his “sixth-year itch” that featured a great Democratic Senate map much like this year’s excellent Republican map.
Republicans can net up to seven Senate seats by simply winning all of the states on this year’s map where there is currently a Democratic senator representing a state won by Mitt Romney in 2012. Earlier this year, we called such an outcome “gale force white caps,” meaning a great stirring of the political seas that fell short of a “wave,” politically speaking, because Republicans would essentially just be winning in states where one would expect them to win in a Republican-leaning year with a Democrat in the White House. It would be more of a “correction” in this era of polarization than a wave. Thus, we’re defining a “wave” in the Senate this year as such:
Republicans need to: (1) Win control of the Senate and (2) Win at least one seat in a state won by President Obama in 2012 (most likely Colorado or Iowa).
We floated this definition on Twitter, and got some interesting reactions:
@kkondik people seem to be conflating terrain and mood to make a wave. How many O states do Rs win in Senate, how many O 52%+ CDs?
— Chris at PTS (@ChrisatPTS) September 9, 2014
GOP +7 means knocking off 4 incumbents (or nabbing O state open seats.) Historically that looks like a wave @kkondik pic.twitter.com/vDDG3cnDJi
— Liam Donovan (@LPDonovan) September 9, 2014
@kkondik @baseballcrank @SalenaZitoTrib I think a clear GOP win in NC would be evidence of a wave
— Nate Cohn (@Nate_Cohn) September 9, 2014
.@kkondik I think a wave by definition has to impact downballot too & see wide swing in national popular vote. Sen map alone doesn’t cut it — Stephen Wolf (@StephenWolfUNC) September 9, 2014
@ThePlumLineGS @SalenaZitoTrib @kkondik +7 is a win. +8 or more is a wave. Can’t get there w/o IA, CO, MI, or another blue.
— Dan McLaughlin (@baseballcrank) September 9, 2014
All of these comments are worthwhile, and they suggest that, unless the GOP truly sweeps on Nov. 4, we’re going to have a vigorous debate about whether there was a wave or not.
You might be saying: “Who cares? This is all semantics.” Not really. This midterm election should be interpreted in light of the broader shifts in U.S. politics being driven by demographics (the growth of the minority vote percentage, the tilt of voters under 30 to Democrats because of their racial makeup and social issues, and the transformation of the political map as seen in 2008 and 2012, with states such as Colorado, Florida, Nevada, North Carolina, and Virginia becoming purple or blue, and the border states of Arkansas, Kentucky, Tennessee, and West Virginia becoming very red). As long as a presidential election features strong, competitive nominees in both major parties, Democrats start out with a sizable head start in the Electoral College. A Democrat need win only a few purple states to reach 270 electoral votes, but a Republican has to thread the eye of many purple needles to take the White House.
Therefore, nonpartisan analysts will look to see whether Republicans have made up ground in 2014 in key swing districts and states. How many Obama states and districts have voted GOP for senator or representative? (Gubernatorial battles are in a different category for lots of reasons.) If Republican candidates are just winning red states, then it means that the entire burden for a breakthrough falls on the party’s 2016 presidential nominee. And let’s also keep in mind that the lower, GOP-heavy midterm turnout (lower minority and youth proportions, higher white and older percentages) very probably won’t be any kind of mirror of the 2016 turnout.
Republicans proved in 2010 they could win big in a midterm year. That year undeniably featured a large wave — and look what it got the GOP in 2012. It very well may be that 2014 will show again that the GOP can triumph in a midterm during the Obama era. But the relationship between the midterm results and the next White House battle will be tenuous once more unless we see some real surprises in about seven weeks.
A quick Senate overview
As the election approaches, we’re starting to get more high-quality polling in some of the key races. As Table 1 shows below, many of the races remain quite close. In addition to our race ratings, we’re also showing where the polls stand right now, based on the two polling averages we consult most frequently, HuffPost Pollster and RealClearPolitics.
Table 1: Current Crystal Ball ratings and polling averages in competitive Senate contests
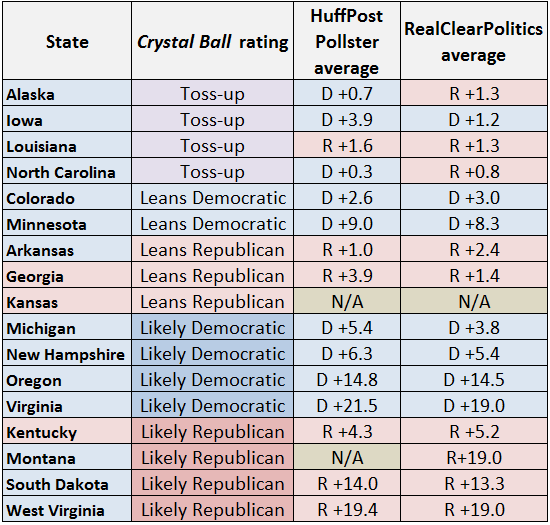
Note: N/A means that RealClearPolitics or HuffPost Pollster did not have averages in these races because of recent candidate changes. The states are shaded by the political party that currently holds the seat. Averages are as of late Wednesday afternoon.
As mentioned above, we’re changing Arkansas from Toss-up to Leans Republican. Nonpartisan polls there are starting to show a lead for Rep. Tom Cotton (R-AR), who is challenging Sen. Mark Pryor (D-AR). Since July, the only polls to show a Pryor lead are either Democratic internals or a single Rasmussen Reports survey, which had Pryor up a point. Democrats hope an investment in their ground game can help here, but in a state where Mitt Romney won close to 61% of the vote in 2012 and where there are relatively few minority voters (compared to other Republican-leaning Southern states) to turn out, Cotton has to be viewed as a small favorite here, even though Pryor is definitely still in the game.
Our four Toss-ups — Alaska, Iowa, Louisiana, and North Carolina — are harder to pin down, although Louisiana is probably still the likeliest to be the fifth Democratic state to flip, getting the GOP to the low end of our five-to-eight seat projection.
We’ve stubbornly held Colorado as a Leans Democratic state, and Sen. Mark Udall (D-CO) now has a slightly bigger lead than he’s had before, although Democrats worry that President Obama’s low numbers in the Centennial State will drag down both Udall and Gov. John Hickenlooper (D-CO).
Despite the seeming closeness of the races in Michigan and New Hampshire, we still like the Democrats’ chances in those places — barring a significant downturn for the party nationally. We went out on a limb in late July by dubbing Minnesota a sleeper and moving it from Likely Democratic to Leans Democratic, and yet Sen. Al Franken (D-MN) retains a bigger lead than Rep. Gary Peters (D-MI) and Sen. Jeanne Shaheen (D-NH) in states where the Democrats are at Likely Democratic in our ratings. If Mike McFadden (R-MN), Franken’s opponent, doesn’t get moving soon, we’ll obviously reassess and upgrade Franken.
We remain confident of GOP holds in Georgia and Kentucky: Senate Minority Leader Mitch McConnell (R-KY) in particular seems to be moving further into the clear in a race we’ve called Likely Republican for the entire cycle. Kansas is a big question mark: Since we updated the race last week, it appears that former Democratic candidate Chad Taylor might have to stay on the ballot. That hurts independent Greg Orman, although Taylor’s level of support should dwindle. In any event, a primary-weakened Sen. Pat Roberts (R-KS) remains a small favorite but he and his GOP allies are in for quite a fight.
Likely Republican pickups in Montana and West Virginia are closer to moving to the Safe column than the more competitive Leans category. The same can be said on the Democratic side in Oregon and Virginia, where incumbent Democrats have big leads. Finally, in South Dakota, Republicans remain on track for a pickup, although former Gov. Mike Rounds (R) is polling well under 50% in a three-way field.
Table 2: Crystal Ball Senate ratings changes

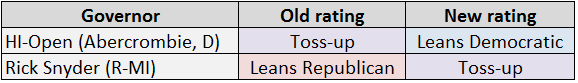
P.S. A note on the governors
Even as we have slightly downgraded Democratic chances in the Senate, their chances have improved in a couple of blue state gubernatorial races.
Hawaii: While unpopular Gov. Neil Abercrombie (D) might have been in serious trouble in the general election, state Sen. David Ige (D) crushed the incumbent in a record-setting primary win. What is Ige’s most important attribute in his matchup with former Lt. Gov. Duke Aiona (R)? His party label, in a very Democratic state. Although former Honolulu Mayor Mufi Hannemann, an ex-Democrat running as an independent, complicates the race to some degree, Hannemann’s candidacy loses some of its raison d’être with Abercrombie out of the picture. With the relatively undefined Ige as the Democratic nominee, the state seems more likely to stick to its partisan guns, making Aiona at least a slight underdog at this point in the campaign. In light of this, we’re shifting this contest from Toss-up to Leans Democratic. Still, this won’t be a cakewalk for Democrats, and the flush-with-cash Republican Governors Association could intervene here in a big way, forcing the Democratic Governors Association to counter.
Michigan: Gov. Rick Snyder (R) holds what has been an ever-shrinking polling lead over former Rep. Mark Schauer (D) in the Wolverine State’s gubernatorial matchup. Snyder’s party identification may well be weighing him down in a state where President Obama won at least 54% in both his election wins. While Snyder holds a small lead, Rep. Gary Peters (D) is ahead of former Michigan Secretary of State Terri Lynn Land (R) in the state’s Senate contest. Considering our Likely Democratic rating in the Senate race, Peters may help pull Schauer’s numbers up in the Democratic-tilting state, so we’re moving the Snyder-Schauer contest from Leans Republican to Toss-up. Because of the power of incumbency and his financial advantages, Snyder is still in a somewhat better position than Schauer to win, but it’s quite close and the undecided voters here are friendlier to Democrats than in some other states. Meanwhile, to the west, we’re not quite ready to move the Wisconsin gubernatorial race to Toss-up yet, but Gov. Scott Walker’s (R-WI) Leans Republican rating is very shaky.
Want another argument for why this may not really be a Republican wave year? More Republican than Democratic gubernatorial incumbents may lose, although we admitted earlier that contests for governor are different animals.
Table 3: Crystal Ball gubernatorial ratings changes
Larry J. Sabato is the director of the Center for Politics at the University of Virginia.
Kyle Kondik is a Political Analyst at the Center for Politics at the University of Virginia.
Geoffrey Skelley is the Associate Editor at the Center for Politics at the University of Virginia.
See Other Commentary by Larry Sabato
See Other Political Commentary by Kyle Kondik
See Other Political Commentary by Geoffrey Skelley
See Other Political Commentary
Related Articles


Rasmussen Reports is a media company specializing in the collection, publication and distribution of public opinion information.
We conduct public opinion polls on a variety of topics to inform our audience on events in the news and other topics of interest. To ensure editorial control and independence, we pay for the polls ourselves and generate revenue through the sale of subscriptions, sponsorships, and advertising. Nightly polling on politics, business and lifestyle topics provides the content to update the Rasmussen Reports web site many times each day. If it's in the news, it's in our polls. Additionally, the data drives a daily update newsletter and various media outlets across the country.
Some information, including the Rasmussen Reports daily Presidential Tracking Poll and commentaries are available for free to the general public. Subscriptions are available for $4.95 a month or 34.95 a year that provide subscribers with exclusive access to more than 20 stories per week on upcoming elections, consumer confidence, and issues that affect us all. For those who are really into the numbers, Platinum Members can review demographic crosstabs and a full history of our data.
To learn more about our methodology, click here.