Demographics and Expectations: Analyzing Biden and Trump’s Performances
A Commentary By Lakshya Jain
KEY POINTS FROM THIS ARTICLE
— The predictive power of demographics makes county margins strongly correlated and thus inferable from each other. Comparing the actual results to the expected results based on county demographics gives us a better idea of candidate performance.
— In the 2020 presidential election, Democrats overperformed in states with high numbers of educated white voters, such as Texas, Arizona, and Georgia. They also began to show signs of hitting their electoral floors in much of Appalachia.
— Strong Republican showings with evangelicals, non-college whites, and Hispanics helped Trump overperform in Florida, Iowa, and Ohio.
Where Biden and Trump overperformed in 2020
Was the swing in South Texas’ Rio Grande Valley really all that surprising in the context of the 2020 election results? Were the sharp swings left in New England really anything extraordinary, given how the rest of the nation voted?
Candidates and parties often chalk up results in individual areas to factors solely dependent on those areas themselves, but in 2020, the predictive power of demographics has made county margins stunningly correlated and inferable. Counties do not vote independently of each other; in fact, given nationwide results and an area’s underlying demographics, we can actually predict an individual county’s 2020 partisanship at the presidential level to within an average of 2.4%!
In this article, we will use a regression-based model that regresses 2020 results against the demographics, trends, and partisanship on a county-level basis, and we will use this to examine candidate performance in an area. Put simply, it will tell us how much a county’s margin deviated from the expected result in the context of the national environment.
This helps us establish a better baseline for expected results on a statewide basis, which helps us better evaluate how well a party or a candidate actually did in a given state compared to what demographics and the national environment would have predicted.
For example, Texas is a state in which many Democrats expected to do better than the R +5.6 margin that actually occurred, but the nationwide results suggest that they actually did extremely well in keeping it as close as they did: The modeled underlying factors would have actually suggested an R +8.2 margin in the Lone Star State.
In this manner, examining the results for the two major presidential candidates on a county-level basis against what was expected will give us a better picture of candidate over and under-performance. In this article, we will do this for several regions of interest in the 2020 election. The factors we consider will be race, religion, age, income, education, partisanship, urbanization, 2016 partisanship, and the demographic and partisan trends of an area between 2012 and 2016. In calculating performance above expected, we will be comparing the true two-party partisan margin to the expected one.
Below, we see a national map showing each candidate’s overperformance by county (you can click on any of the maps to see a larger version).
Map 1: Where Biden or Trump did better than model expectations
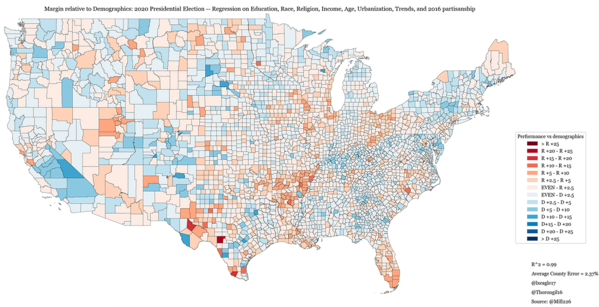
With this, we will be examining the Percent Above Expected (PAE) for Joe Biden and Donald Trump in the 2020 presidential election across five different regions; namely, Appalachia, the South, the Western Sun Belt, the Midwest, and New England.
APPALACHIA
Map 2: Biden/Trump performance relative to model expectations in Appalachia
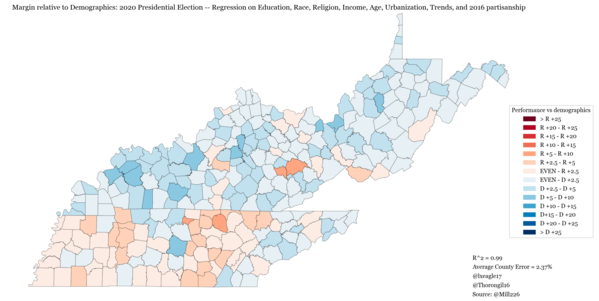
Interestingly enough, some of Biden’s strongest overperformances came in Appalachia, where there appears to be significant evidence that Democrats are now hitting their electoral floor; demographically similar areas in the upper Midwest saw significantly harder swings right than the ones in Appalachia, with much higher rates of attrition in Democratic support. In Kentucky (+2.6 Biden PAE), Trump’s margins were significantly lower than expected across the state, with several areas in the east seeing rightward swings that were significantly less pronounced than expected and several areas in the west seeing swings to the left that were far greater than expected. This could hint that the rate of erosion of support for the Democratic Party in these places ancestrally favorable to them is significantly declining.
This theory is supported by Biden’s performances in West Virginia (+2.4 Biden PAE) and Tennessee (+0.6 Biden PAE). The mountain areas of both states saw a Biden overperformance despite being relatively racially homogenous, rural, and with a high concentration of low-income, religious non-college whites. These are the types of areas that swung rightward across the nation, but in the core Appalachian states, Biden managed to buck this trend to some degree (even as Trump still won these states in landslides overall).
The Appalachian overperformances extended to north Georgia, north Alabama, and western North Carolina as well, giving some hints that the non-Midwestern parts of the region as a whole, which have been more Republican-leaning for quite some time, may now be hitting a floor in Democratic support.
THE SOUTH
Map 3: Biden/Trump performance relative to model expectations in the South
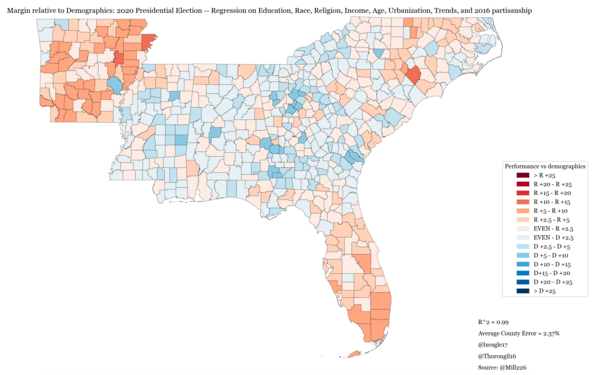
Perhaps no states were as hotly debated in 2020 as the trio of North Carolina, Georgia, and Florida. However, the electoral results in these states were very different, in part due to the diverging demographics and electoral trends seen in each state.
Georgia (+1.9 Biden PAE) was arguably the biggest Democratic success story of the cycle, with Democrats picking up two Senate seats in the runoff and flipping the state at the presidential level for the first time since 1992. Biden’s significant strength with white, well-off social liberals in the suburban Atlanta area was key to powering this flip; had it voted in line with expectations, Republicans would have actually held the state. Biden’s overperformance here was manifested in his doing five-and-a-half points above expected in Gwinnett County and eight points above expected in Henry, which showed just how different the state’s voting patterns are as compared to those seen even eight years ago. Interestingly, we see that Democrats also overperformed in the Appalachian region of north Georgia, which is consistent with the results observed in Kentucky, West Virginia, and Tennessee and may hint at a plateau of Republican support being hit in these areas.
Meanwhile, in Florida (+3.8 Trump PAE), the Republican Party overperformed all across the state, and this is best shown by Trump making significant inroads into the Democratic bases in Palm Beach, Broward, and Miami-Dade counties (the three big southeastern counties situated along the Atlantic coast), where he performed anywhere between seven to nine points above expected, depending on the county. Trump’s strength with Cubans and other voters with Caribbean ancestry meant Democrats did not hit the necessary margins in any of these three counties that they needed in order to win the state, which negated their gains in other parts of the state, such as the Jacksonville and Pensacola areas. Had Florida voted as demographics predicted, Democrats may have won the state; as it was, however, they suffered their largest loss at the presidential level there since 2004.
North Carolina (+0.8 Trump PAE) is another fascinating case study, as Democrats appear to have suffered from extremely low rural Black turnout in the east of the state. This, combined with their underperformances in Durham, Mecklenburg (Charlotte), and Wake (Raleigh) — between one to three percentage points below expected, depending on the county — cost them the state. Interestingly, the western part of North Carolina, which is part of Appalachia, saw an overperformance consistent with those seen in Kentucky, Georgia, Tennessee, and West Virginia, again providing more evidence for the notion that Democrats may be near or rebounding from their floor in these areas.
Finally, on an interesting note, Arkansas (+2.2 Trump PAE) saw one of the largest Trump overperformances. It is possible that Hillary Clinton, the state’s former first lady, may have actually had some residual strength in the state that prevented it from sliding as far right as it may have otherwise done in 2016; thus, in 2020, Trump swung more votes than one may have expected, enabling him to carry the state by 28 points, a slight improvement on his 2016 showing.
THE WESTERN SUN BELT
Map 4: Biden/Trump performance relative to model expectations in the Western Sun Belt
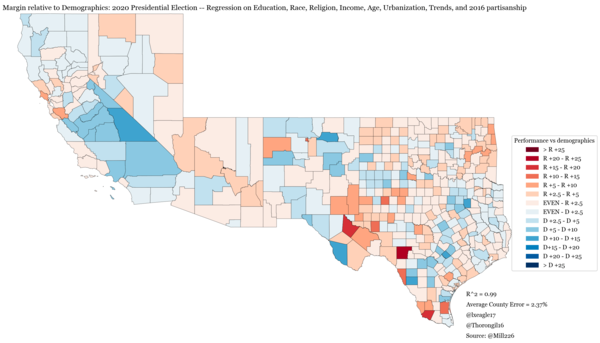
A lot of focus was put on Texas (+2.7 Biden PAE) and Arizona (+1.2 Biden PAE) in the build-up to the election. However, while Biden’s overperformance in counties with heavy amounts of white college voters was evident in both states, their relative partisanships meant they went to differing parties. In Arizona, his overperformance in Maricopa (Phoenix), where he did roughly 2% better than expected, was crucial to fueling his flip of the state, which voted for Trump by about 3.5 points in 2016.
Texas, however, voted for Trump by nine points in 2016, and the heavy vote firewall that Republicans held meant that even a sharp swing left overall still saw Trump carry the state by 5.6 points. Biden was hurt in part by heavy swings towards the Republicans in the Rio Grande Valley. However, in the context of national results, Biden actually overperformed quite significantly in the state despite what the raw vote margin may have indicated, aided largely by his strength with white college voters in the Austin, Dallas-Ft. Worth, San Antonio, and Houston metro areas. In particular, he performed nine points above average in San Antonio, between three to six points above average in the Dallas-Fort Worth suburban quad (depending on the county), and six points above average in suburban Hays County, near Austin. All of these areas have a heavy concentration of white college-educated voters, but even accounting for that demographic group’s leftward turn across the nation, Biden still swung them by far more than what one would have expected given national results.
The Rio Grande Valley saw a pronounced swing rightward, but much of it was actually expected based on the national Hispanic swing rightward. In particular, Webb County and Hidalgo County swung 28 and 23 points to the right, respectively, but each voted within 1% of what was expected. Meanwhile, Cameron County, which saw a 19-point swing rightward, actually saw Biden doing a point better than one would expect given national results. This suggests that the swing in the Rio Grande Valley was not necessarily reflective of issues limited to just that region of South Texas and was, in fact, part of a larger national swing right among Hispanics, especially among those who are religious and do not have a four-year college degree.
MIDWEST
Map 5: Biden/Trump performance relative to model expectations in the Midwest
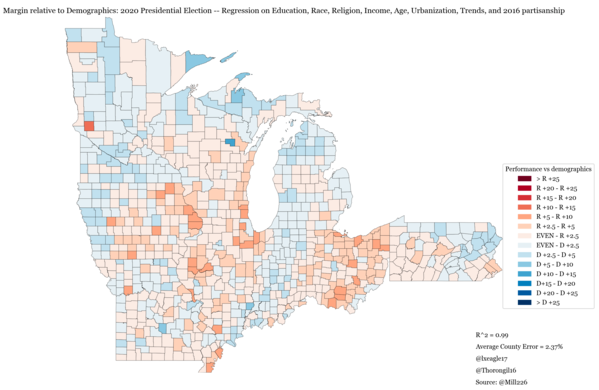
The Midwest was perhaps the most electorally significant area where both Trump and Biden sold themselves as having unique strengths: Biden due to his wins with Barack Obama in 2008 and 2012 and connection to his hardscrabble childhood home of Scranton — Pennsylvania is included here as a Midwestern state because of its electoral similarities to the other, classically Midwestern states — and Trump due to his 2016 victory, which saw the area take a sharp lurch rightwards. However, the picture was far more mixed for both candidates in 2020.
Biden overperformed in Michigan (+0.6 Biden PAE), Indiana (+0.8 Biden PAE), Missouri (+0.5 Biden PAE), and Minnesota (+0.4 Biden PAE). Interestingly, in carrying both Michigan and Minnesota, Biden’s overperformances were not only in areas with concentrations of educated white voters — Kent County, Michigan and Anoka County, Minnesota are both prime examples of this — but also in secular working-class counties such as Sibley County, Minnesota, in which Biden actually improved on Clinton’s margins, contrary to expectations. However, Biden’s relative overperformance in Michigan and Minnesota, while perhaps interesting to note, is still relatively slight as a whole; much of the swing left is explained entirely by the demographics of the two states, each of which saw better turnout and a sharp, yet expected, swing left by college whites, rather than any region-specific strength or weakness of either candidate.
In contrast to his overperformances in Michigan and Minnesota, however, Biden underperformed in Illinois (+1.6 Trump PAE), Ohio (+2.3 Trump PAE), Wisconsin (+1.9 Trump PAE), Iowa (+1.6 Trump PAE), and Pennsylvania (+0.8 Trump PAE). Interestingly, however, these underperformances come for differing reasons, showcasing the coalitions that each candidate drew their respective strength from.
Biden’s Wisconsin and Pennsylvania underperformances came primarily due to the suburban counties not swinging nearly as much as predicted. Biden underperformed quite significantly in the Philadelphia collar and in the suburban Wisconsin counties of Waukesha, Ozaukee, and Washington, which ensured that the states were far closer than one would have envisioned given the nationwide demographic swings among college-educated white voters. To the extent that any expected “home state bounce” materialized for Biden in Pennsylvania, it was largely limited to the northeast of the state, in and around his hometown of Scranton, shown by him doing three points better than expected in Lackawanna County.
Compared to the results seen in Pennsylvania and Wisconsin, Trump’s overperformances in Iowa and Ohio are notable because they come in areas with heavy rates of religiosity with previously high wells of Democratic support. These areas lurched far more sharply to the right than expected, and they were more than enough to ensure that the pre-election possibility of Biden carrying the two states would not come to fruition.
It appears as if the Republican Party’s strength with evangelicals and religious, working-class whites may be beginning to take hold in areas where the realignment had not hit quite as strongly, and the rates of erosion in Democratic support were thus significantly faster than one might have expected given the other 2020 results across the nation. It is worth noting, also, that the Appalachian parts of Ohio and Pennsylvania saw Biden underperformances that diverged significantly from much of the rest of Appalachia, which has recently been (and still is) more Republican. It may be that these northern areas of Appalachia are continuing to align with the rest of the region’s voting patterns.
NEW ENGLAND
Map 6: Biden/Trump performance relative to model expectations in New England
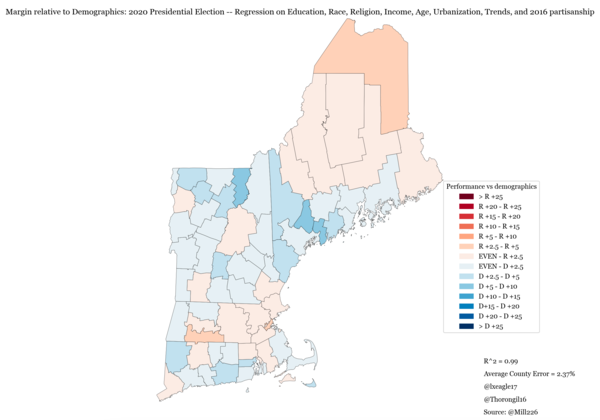
At the presidential level, New England saw some of the most pronounced shifts leftwards, with New Hampshire swinging seven points to the left. However, data suggests that Biden’s overall performance was roughly in line with what was expected given the demographics of the area; with a heavier-than-usual dose of secular and educated white voters, New England was full of the types of voters that swung strongly to the left in the 2020 election.
The only states where Biden performed more than a point above or below expectations were Maine (+1.7 Biden PAE) and Massachusetts (+1.1 Trump PAE). The others, Connecticut (+0.3 Biden PAE), Rhode Island (0.0 Biden PAE), New Hampshire (+0.8 Biden PAE), and Vermont (+0.7 Biden PAE), performed more in line with expectations. While the slight leftward swings in the latter four states were expected given their demographics, Biden’s performance was surprisingly stronger in Maine, where the proportion of college-educated voters is significantly lower than in other New England states, and weaker than usual in Massachusetts, which is highly educated in general and thus was expected to swing further to the left than it really did.
Conclusion
Overall, we see that the uniquely predictive power of demographics make swings extremely strongly correlated across the nation. The factors that caused Hispanics to swing right in areas like Southern California and Miami-Dade also were evident in the swing seen in the Rio Grande Valley, while the factors that saw white college voters take a sharp turn left were evident in states ranging from Michigan to Georgia to Texas. By isolating out these factors with a demographic regression model, we can better analyze overperformances with respect to the national environment, which helps us better understand electoral trends as well as the candidates’ strengths and weaknesses unique to states and areas.
Lakshya Jain is a software engineer who recently graduated from UC Berkeley with a Masters’ in Computer Science, with a focus on machine learning. His data-centric background and political interest led him to analyze elections in his spare time. More of his analyses can be found at politicalsalad.com or on Twitter @LXEagle17.
See Other Political Commentary.
This article is reprinted from Sabato's Crystal Ball.
Views expressed in this column are those of the author, not those of Rasmussen Reports. Comments about this content should be directed to the author or syndicate.
Related Articles

Rasmussen Reports is a media company specializing in the collection, publication and distribution of public opinion information.
We conduct public opinion polls on a variety of topics to inform our audience on events in the news and other topics of interest. To ensure editorial control and independence, we pay for the polls ourselves and generate revenue through the sale of subscriptions, sponsorships, and advertising. Nightly polling on politics, business and lifestyle topics provides the content to update the Rasmussen Reports web site many times each day. If it's in the news, it's in our polls. Additionally, the data drives a daily update newsletter and various media outlets across the country.
Some information, including the Rasmussen Reports daily Presidential Tracking Poll and commentaries are available for free to the general public. Subscriptions are available for $4.95 a month or 34.95 a year that provide subscribers with exclusive access to more than 20 stories per week on upcoming elections, consumer confidence, and issues that affect us all. For those who are really into the numbers, Platinum Members can review demographic crosstabs and a full history of our data.
To learn more about our methodology, click here.