The Surprisingly Unrepresentative 2014 Senate Map
A Commentary By Kyle Kondik
Crystal Ball Managing Editor Kyle Kondik recently wrote a piece for Politico Magazine about 10 maps that explain the 2014 election. We wanted to highlight one of the maps, which shows how this year’s Senate contests are being contested on very Republican turf — and that a very small number of voters in some fairly conservative states could flip control of the Senate this year. This excerpt features the Political Map of the United States, which readers might remember from past editions of the Crystal Ball. — The Editors |
The Political Map of the United States and the 2014 Senate class
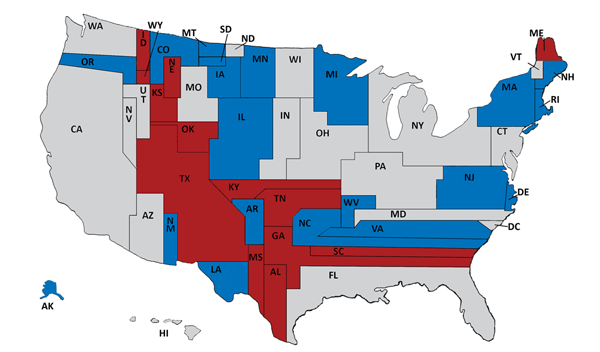
This map shows the 2014 Senate races in blue and red, with the states sized according to their population and colored based on their current occupant. (The gray states are those with no regular Senate election this year.)
Senate Class 2, the one contested this year, is far less representative of the nation as a whole than the two other classes. Its 33 states contain slightly more than half (51.8%) of the nation’s population. Class 1 (the 2012 class) also features 33 states, but those states host three-quarters (75.2%) of the population; Class 3, coming in 2016 with 34 states, is similar to Class 1, with 72.6% of the population.
One big reason the 2014 Senate class is so unrepresentative is that California, with its 38 million residents (about an eighth of the country’s population), has no Senate election this year. Neither do New York, Florida, Pennsylvania and Ohio, respectively the nation’s third, fourth, sixth and seventh biggest states. No Senate election is ever a national election — but this year’s least of all.
Republicans, as mentioned, need to net six seats to win the Senate, and there are six Democratic-held seats on this map where President Obama got less than 45% of the vote in 2012. Let’s assume the GOP nets those six seats, but everything else remains the same, which is a perfectly plausible scenario. Those states — Alaska, Arkansas, Louisiana, Montana, South Dakota and West Virginia — represent just 3.8% of the U.S. population.
Of course, the actual number of residents who are eligible to vote, who show up to vote and who cast a ballot for the GOP candidate is an even smaller share. Assuming turnout in line with the most recent midterm, control of the Senate could end up being switched by 2 million Republican voters, or less — just 0.6% of the American population. That would hardly be a national mandate, though Republicans would assuredly claim one anyway.
To read the whole column, click here.
Kyle Kondik is a Political Analyst at the Center for Politics at the University of Virginia.
See Other Political Commentary by Kyle Kondik
See Other Political Commentary
Views expressed in this column are those of the author, not those of Rasmussen Reports. Comments about this content should be directed to the author.
Related Articles


Rasmussen Reports is a media company specializing in the collection, publication and distribution of public opinion information.
We conduct public opinion polls on a variety of topics to inform our audience on events in the news and other topics of interest. To ensure editorial control and independence, we pay for the polls ourselves and generate revenue through the sale of subscriptions, sponsorships, and advertising. Nightly polling on politics, business and lifestyle topics provides the content to update the Rasmussen Reports web site many times each day. If it's in the news, it's in our polls. Additionally, the data drives a daily update newsletter and various media outlets across the country.
Some information, including the Rasmussen Reports daily Presidential Tracking Poll and commentaries are available for free to the general public. Subscriptions are available for $4.95 a month or 34.95 a year that provide subscribers with exclusive access to more than 20 stories per week on upcoming elections, consumer confidence, and issues that affect us all. For those who are really into the numbers, Platinum Members can review demographic crosstabs and a full history of our data.
To learn more about our methodology, click here.