An Over/Under on Democratic House Gains
A Commentary by Kyle Kondik
In sports betting parlance, an “over/under” is a bet on whether there will be more or less of a given statistic in a certain game. So, in a football game, say the over/under is 50; gamblers would bet whether the total points scored would be more or less than 50. We include this reference just to make sure readers know what we’re talking about here, and also to include a regular Crystal Ball disclaimer: It’s our policy to never bet money on elections because we do not want to compromise our ratings.
That said, if the hypothetical Crystal Ball Casino (that actually sounds like a casino name, right?) were to offer an over/under bet about the number of seats Democrats will win in the 2012 U.S. House elections, the relevant number would not be 218 — a bare House majority — but rather 200. Democrats have little shot at winning the House majority, but they do appear capable of winning some seats. The question is — how many?
If we had to call all the races today, we’d estimate a Democratic gain of somewhere between five and 10 seats, with a specific guess of Democrats plus six. That would place the Republican majority at 236, with 199 Democrats, or one below the over/under. Such a scenario would involve Democrats winning the majority of our 16 toss-ups, while also winning a few seats that currently lean toward the GOP.
One possible outcome for the “over/under” 200 question for the Democrats would be a “push” — 200 seats on the nose, or a Democratic gain of seven.
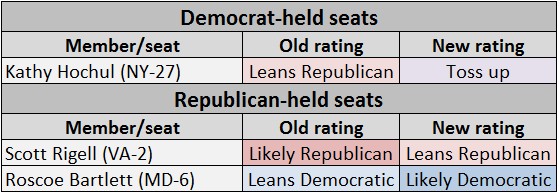
Chart 1: Crystal Ball House rating changes
Since our last update two weeks ago, we’ve made a few tweaks in our House ratings, all favorable to Democrats:
The growing consensus seems to be that Rep. Roscoe Bartlett (R-MD) is a goner, not only because Maryland Democrats redrew his seat to elect a Democrat but also because it seems as though Republicans won’t be all that sad to see the unpredictable octogenarian go. He and freshman Rep. Joe Walsh (R-IL) are the only two Republicans we place in the “likely Democratic” category — making them the two GOP incumbents likeliest to lose in November.
Rep. Kathy Hochul (D-NY), known for her improbable, Paul Ryan-budget-aided special election win in 2011, saw her already Republican district made even Redder in redistricting — she now occupies the most Republican district in New York (President Obama only won 44% of the vote there in 2008). That said, candidates matter, and Hochul proved her mettle in her special election win, while Republican opponent Chris Collins lost his own bid for reelection as Erie County executive in 2011 and has a penchant for making ill-advised comments. This is an uphill slog for Hochul in Western New York, but so was her special election victory.
Meanwhile, Rep. Scott Rigell (R-VA) has been acting somewhat cautiously of late, which is perhaps indicative of his own vulnerability. He was one of only two Republicans to vote against holding Attorney General Eric Holder in contempt of Congress (Rep. Steve LaTourette of Ohio, who is super safe despite residing in what could be a swing district, was the other). He also has drawn national attention for reneging on Grover Norquist’s no-tax pledge. Rigell is wealthy and can self-fund, but so can businessman and Sen. Mark Warner ally Paul Hirschbiel, Rigell’s Democratic foe. In the right year, this Hampton Roads-area seat could flip (as it did in 2008 to Democrat Glenn Nye), and it should be listed among other competitive but leaning Republican seats.
With these changes, the Crystal Ball now lists 16 toss-ups, with 233 seats safe, likely or leaning to the Republicans and 186 seats safe, likely or leaning to the Democrats. House ratings for all 435 seats are available here.
Redistricting 2014: More maps to come?
Even though 2012 is the national redistricting year — most states will use their new lines through 2020 — that does not mean that the maps will stay the same in all states in the 2014 midterms.
It appears likely that Ohio voters will get the chance to implement an independent redistricting commission through a statewide ballot issue this November. Currently, the Buckeye State has a congressional map gerrymandered by Republicans to consistently win 12 of the state’s 16 U.S. House seats. Presumably, an independent commission would benefit Democrats — probably to the tune of a net gain of two to four seats in a non-wave year. Maryland’s congressional map might also be up for review by voters this year.
Meanwhile, it’s also possible that courts will dismantle maps in places such as West Virginia and Texas. That likely wouldn’t mean much in the Mountain State, which only has three House seats, but the Lone Star State, with the second-most House seats in the country (36), could easily elect more Democrats under a new map.
A Democratic majority, but a Republican speaker?
If Democrats were to win the House, it would probably only be by a seat or two, giving Democrats perhaps a bare majority: 218-217. Such a victory would probably be delivered, in part, by victories by Democratic incumbents in conservative districts, such as Reps. Hochul, Mark Critz (D-PA) and Jim Matheson (D-UT), among others. Would all of them vote for a Democrat for Speaker of the House, particularly if that Democrat was the liberal Nancy Pelosi?
Critz voted for Pelosi for speaker in 2011, but Matheson, for instance, voted for conservative Rep. Heath Shuler (D-NC), who is retiring. So did other endangered Democrats, such as Reps. Larry Kissell and Mike McIntyre (NC). If they survive races where they most likely distanced themselves from President Obama and the national Democratic Party, those Democrats would face immense pressure to elect a more moderate Democrat as speaker, to vote for a Republican or even to switch parties.
There is some historical precedent here: House Speaker James Beauchamp “Champ” Clark (D-MO) managed to keep his job after the 1916 elections, despite Democrats failing to win a House majority that year (a handful of third party representatives allowed Clark to keep the speakership).
On the flipside, what if Democrats got to 216 or 217 seats? It seems likelier that the Republican caucus would hold together on a leadership vote, but depending on who was elected from what district, that too could be a rather dramatic vote.
Toward 2014 and beyond
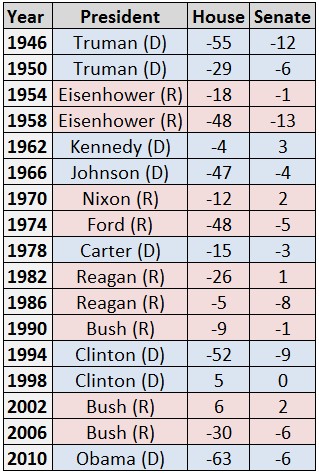
History tells us that whichever party wins the White House in 2012 will probably lose House seats in 2014. That’s because the incumbent presidential party has lost seats in 15 of the 17 midterm elections held since 1946 — the two exceptions were 1998 (when Republicans were punished for their impeachment of President Clinton) and 2002 (when Republicans gained seats in the aftermath of 9/11 and the run-up to the Iraq war).
One can imagine a backlash against a first-term President Romney in 2014, and without Obama in the White House, one can also imagine Democrats rebounding in places where the president is highly unpopular, such as Southeast Ohio, Western Pennsylvania, West Virginia or Arkansas. Politics, after all, is cyclical, and although Democratic fortunes appear dim in much of the old Confederacy, the Border States and Greater Appalachia, the political realities that seem ironclad today might not be so ironclad tomorrow. Obama does not fit these districts, but a President Romney might not either.
Meanwhile, it’s hard to see Democrats gaining seats in 2014 during a second Obama term, as the “sixth-year itch” will kick in for the president, likely bolstering Republican prospects in the House and further freezing out Democrats in white, working class areas.
Chart 2: House/Senate gain or loss for president’s party in midterm election years, 1946-2010
Source: Pendulum Swing (2011)
Kyle Kondik is the House Editor at the Center for Politics at the University of Virginia.
See other Political Commentary by Kyle Kondik .
See Other Political Commentary
Views expressed in this column are those of the author, not those of Rasmussen Reports. Comments about this content should be directed to the author.
Rasmussen Reports is a media company specializing in the collection, publication and distribution of public opinion information.
We conduct public opinion polls on a variety of topics to inform our audience on events in the news and other topics of interest. To ensure editorial control and independence, we pay for the polls ourselves and generate revenue through the sale of subscriptions, sponsorships, and advertising. Nightly polling on politics, business and lifestyle topics provides the content to update the Rasmussen Reports web site many times each day. If it's in the news, it's in our polls. Additionally, the data drives a daily update newsletter and various media outlets across the country.
Some information, including the Rasmussen Reports daily Presidential Tracking Poll and commentaries are available for free to the general public. Subscriptions are available for $4.95 a month or 34.95 a year that provide subscribers with exclusive access to more than 20 stories per week on upcoming elections, consumer confidence, and issues that affect us all. For those who are really into the numbers, Platinum Members can review demographic crosstabs and a full history of our data.
To learn more about our methodology, click here.


