Moving Beyond the Good Ol’ Boys Club: Recent Trends in Women’s Representation in State Legislatures
A Commentary By Carah Ong Whaley
KEY POINTS FROM THIS ARTICLE
— The percentage of women in state legislatures has increased in recent years. However, there is still a significant gender gap in most states as women have not reached parity in representation.
— The majority of women in state legislatures are Democrats. While more Republican women ran for office in 2022 than in previous years, that didn’t amount to closing the gender gap in representation.
— The percentage of women in state legislatures has increased more in Western and Northeastern states than in Midwestern and Southern states. This is likely due to a number of factors, including the political climate, the level of motivation and activism among women, and the availability of resources for women’s campaigns.
Changes in legislatures
In a special election on May 16, Democrats maintained a narrow majority in the Pennsylvania House of Delegates. As a result, the party will be able to continue to exert control over how the lower chamber of the state legislature will handle reproductive, gun, and voting rights legislation. With Republicans still holding the Pennsylvania Senate, the House could also provide an assist to Democratic Gov. Josh Shapiro in budget negotiations. In House District 163, Democratic candidate Heather Boyd defeated Republican candidate Katie Ford for a vacancy created by Democratic Rep. Mike Zabel, who resigned from the legislature after multiple people, including a lobbyist and other lawmakers accused him of sexual harassment. That two women vied for the House seat is a sign of change for a state legislature that has been accused in the past by other women lawmakers of having a paternalistic culture and being an “Old Boys Club.”
But it’s not just Pennsylvania that’s changing. In early April, as the Tennessee House was about to vote on expulsion resolutions for Reps. Justin Pearson (D-Memphis), Justin Jones (D-Nashville), and Gloria Johnson (D-Knoxville) for leading a protest against gun violence on the House floor on March 30, Johnson told her colleagues in the state legislature that they should welcome a new generation of lawmakers who are going to look and do things differently because they “are fighting like hell” for their constituents. Meanwhile, in Nebraska, a bill that would ban abortion around the 6th week of pregnancy failed to get a crucial 33rd vote to break a filibuster in the technically nonpartisan and unicameral state legislature when Republican Sen. Merv Riepe abstained. When Riepe got pushback on an amendment he introduced to extend the proposed ban from 6 to 12 weeks, he told his Republican colleagues that reproductive rights will have women voting them out of office. He offered as evidence his own narrowing margins of victory against a Democratic woman challenger in a post-Dobbs election as a preview of what’s to come. In South Carolina, where women make up only 11% of the upper chamber, the opposition of all five women, including three Republicans, led to the failure of a near-total abortion ban by a 22-21 vote in April. While a comparatively less strict fetal heartbeat ban did eventually pass in May with the continued opposition of the five women, that they were able to prevent the passage of a stricter bill is another example of how women in decision-making positions can impact policy outcomes.
These vignettes got me thinking about how representation in state legislatures is (or is not) changing and prompted us to do a series examining trends. In this first installment, I examine how women’s representation has changed in American state legislatures since 1975. To analyze change in women’s representation in state legislatures from 1975 to 2023, I compiled data from several sources, including the National Conference of State Legislatures, Ballotpedia, and the Center for American Women and Politics (CAWP) at the Eagleton Institute of Politics at Rutgers University. Political science scholarship has shown that descriptive representation matters. Specifically, scholarship on gender and politics has shown that men and women have different policy preferences, and that female legislators are more likely to emphasize women’s issues and adopt women-friendly policies (see a good review of the literature here).
Now and then
According to CAWP, the number of women serving in state legislatures has more than quintupled since 1971. Figure 1 shows the change in the percentage of women legislators in lower legislative chambers of all 50 states between 1975 and 2023. Readers can hover over each state to see pop-ups with additional information for each state, including a breakdown of women legislators by party each year. Note: Nebraska has a unicameral legislature, but I include it in both upper and lower chamber figures for comparison.
Figure 1: Change in women members in lower chambers, 1975-2023
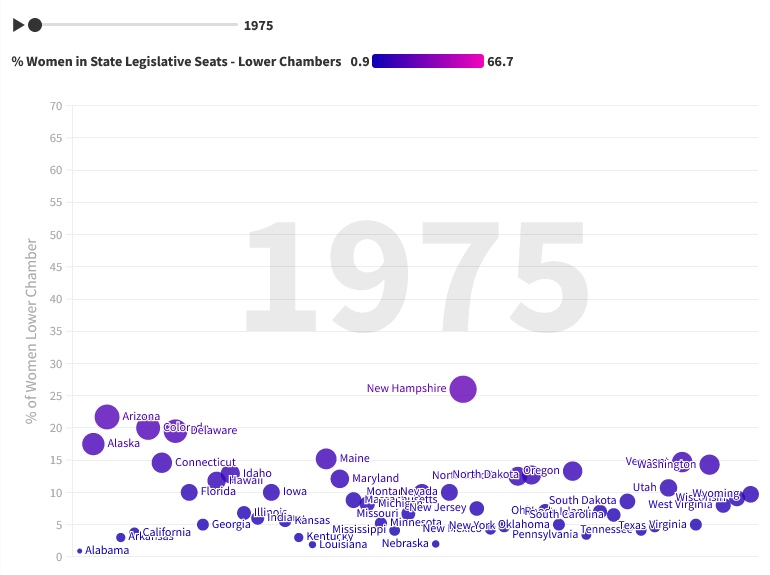
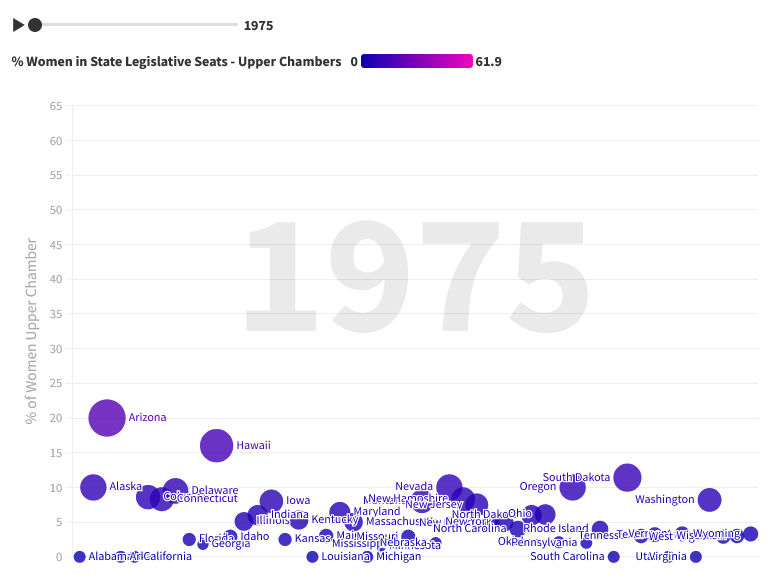
Figure 2 shows the percentage of women legislators in upper legislative chambers of all 50 states between 1975 and 2023. Readers can hover over each state to see pop-ups with additional information for each state, including a breakdown of women legislators by party each year (again, unicameral Nebraska is included on both figures).
Figure 2: Change in women members in upper chambers, 1975-2023
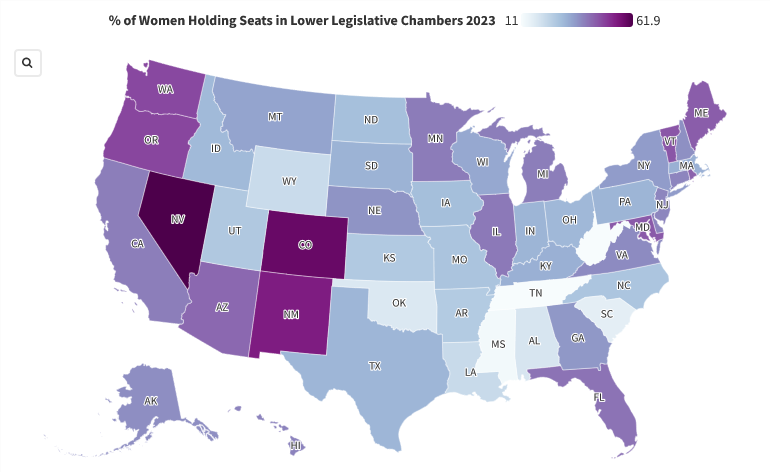
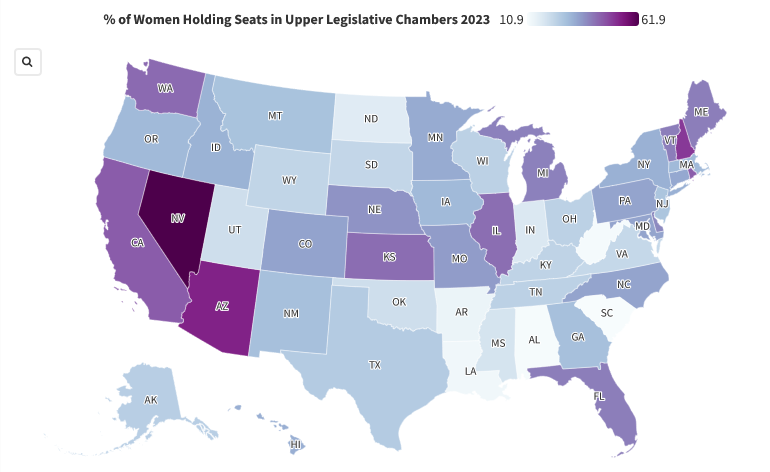
Although it didn’t receive much national news media attention, women scored big in the 2022 elections for state legislative seats. As of this year, almost one-third of state legislators are women, and there is a record number of women serving in state legislatures. Maps 1 and 2 below are shaded by the percentage of women’s representation in upper and lower chambers for each state as of 2023. As Map 1 shows, Nevada has the highest percentage of women serving (61.9%) in lower legislative chambers, while Mississippi has the lowest (11%). Map 2 shows that Nevada also has the highest percentage of women in upper chambers (61.9%), while South Carolina has the lowest (10.9%).
While the increase in representation is a positive sign, there is still a significant gender gap in most states. Women have reached parity in representation in just 3 lower state legislative chambers (Colorado, New Mexico, and Nevada) and in just 3 upper chambers (Arizona, New Hampshire, and Nevada). Compare that to the fact that women make up about 50.7% of the population nationally, according to the U.S. Census Bureau. Women also have higher reported voter registration and voting rates than men for every federal election since 1984, according to data from the Current Population Survey.
As of 2022, the most recent year for which race and ethnicity data is available, the majority of women legislators are white (73.2%). Women of color make up 24.6% of women legislators, with Black women comprising 16.1%, Latinas 6.7%, Middle Eastern .5%, and Native American/Alaska Native/Native Hawaiian 1.3%.
Map 1: Women’s representation in lower legislative chambers, 2023
Map 2: Women’s representation in upper legislative chambers, 2023
Maps 1 and 2 contain pop-up information with additional details by state, including the percentage point change from 2010 to 2023 of women serving in upper and lower chambers. The change in the percentage of women in lower legislative chambers since 2010 ranges from a decrease of 9 percentage points in West Virginia to an increase of 31 percentage points in Nevada. The top 10 states with the greatest percentage point increase in women’s representation in lower legislative chambers are Nevada (+30.9 percentage points), Oregon (+21.6), New Mexico (+21.4), Rhode Island (+20), Colorado (+19.9), Delaware (+19.5), Virginia (+19), Washington (+18.4), Florida (+17.5), and Kentucky (+17). Lower legislative chambers in 6 states experienced no growth or decline: Wyoming (0 pp increase), Kansas (-2.4), North Carolina (-4.2), Mississippi (-4.9), Tennessee (-6.1) and West Virginia (-9), all of which are controlled by Republicans.
Not surprisingly, it has been more challenging for women to break barriers in upper legislative chambers than lower chambers. While women’s representation has increased in 40 of 50 states since 2010, there are still states with relatively low percentages of women serving in the upper chamber. Women have 20% or less of representation in 10 states, all controlled by Republicans: South Carolina (10.9%), Alabama (11.4%), West Virginia (11.8%), Louisiana (12.8%), Arkansas (14.2%), North Dakota (17%), Indiana (18%), Mississippi (19.2%), Utah (20.7%), and Oklahoma (20.8%). And our home base of Virginia, which will have legislative elections later this year, is just barely ahead, with 22.5% of women in the Democratic-controlled state Senate.
There are 10 states that experienced an increase of 15 percentage points or more in women’s representation in upper legislative chambers since 2010: Nevada (+28.6 percentage points), Rhode Island (+23.6), North Carolina (+20), Illinois (+18.7), Florida (+17.5), Wyoming (+16.6), Nebraska (unicameral, +16.3), Michigan (+15.8), New York (+15.7), and California (+15). Upper legislative chambers in 10 states experienced no growth or decline since 2010: Delaware (0 percentage point increase), Hawaii (0), Massachusetts (0), Tennessee (0), Arkansas (-2.9), Colorado (-3), Oregon (-3.3), New Hampshire (-4.1), Alabama (-5.6), Minnesota (-7.5), Indiana (-12), and Louisiana (-12.8).
Why the variation?
The variation in the percentage of women in state legislatures and change can be attributed to a variety of factors, including the political climate, the level of motivation and activism among women, and the availability of resources for women to run and serve in office.
Since Hillary Clinton lost the 2016 election and as issues affecting women’s rights to self-determination have been at the forefront in the last couple election cycles, there has been a renewed interest for women to run for office and serve in politics. In general, there have been more efforts to recruit and train Democratic candidates to run for office. However, the Republican Party is doing a better job of recruiting women than in the past. In 2022, the Republican State Leadership Committee reported that 769 Republican women and minority candidates were elected to state legislative positions, an increase over 2020. The RSLC also said that it spent $5.3 million recruiting, training, and supporting diverse candidates. While more Republican women ran for office in 2022 than in previous years, that didn’t amount to closing the gender gap in representation, especially in Republican-controlled legislatures in the South. As of 2023, one-third of all women state legislators are Republican, and Republican women account for 10.9% of all state legislators.
Overall, the increase in women elected to state legislatures has particularly come from the Democratic Party, with 1,580 Democratic women lawmakers serving in upper and lower state legislative chambers. Two-thirds of all women legislators are Democrats, and Democratic women account for 21.4% of all state legislators. The biggest increase for Democratic women legislators occurred in the 2018 election cycle — we’ll call that the Trump effect.
In addition to the political parties, there are organizations and PACs at the national and state levels focused on recruiting and supporting women. I reviewed a database of organizations that CAWP maintains and found that the majority of the organizations are nonpartisan (65.7%), while 20.5% of them are Democratic-affiliated and 13.8% are Republican-affiliated. Organizations with a national focus make up 15.3% of the total, and the remaining are state-focused (including state-based chapters of national organizations). California (6.2% of all organizations) and Texas (4.2%) stand out with the greatest percentage of state-based organizations. Still, not all women who go through political leadership programs run for office. And the percentage of organizations in a state doesn’t translate to parity.
Conclusions
Good politics and policy depend on diverse perspectives and lived experiences, but women remain underrepresented at all levels of government. As this analysis shows, the number of women in state legislatures is increasing, and this is a positive trend. However, as this analysis also demonstrates, progress is not a given and there are clearly states where more attention to closing the gender gap in representation is needed.
For women to achieve parity in representation, there are structural challenges that states can address, including for example, by increasing salaries for legislators and providing stipends for childcare. There are also ways in which political parties and organizations can address the challenges women and other minoritized candidates face by expanding recruitment, encouragement, and training efforts, while increasing financial support for women to run for office. Openings and incumbency are also issues, and may require encouraging more women to challenge candidates from their own parties in primaries.
See Other Political Commentary by Carah Ong Whaley.
See Other Political Commentary.
Views expressed in this column are those of the author, not those of Rasmussen Reports. Comments about this content should be directed to the author or syndicate.
Related Articles

Rasmussen Reports is a media company specializing in the collection, publication and distribution of public opinion information.
We conduct public opinion polls on a variety of topics to inform our audience on events in the news and other topics of interest. To ensure editorial control and independence, we pay for the polls ourselves and generate revenue through the sale of subscriptions, sponsorships, and advertising. Nightly polling on politics, business and lifestyle topics provides the content to update the Rasmussen Reports web site many times each day. If it's in the news, it's in our polls. Additionally, the data drives a daily update newsletter and various media outlets across the country.
Some information, including the Rasmussen Reports daily Presidential Tracking Poll and commentaries are available for free to the general public. Subscriptions are available for $4.95 a month or 34.95 a year that provide subscribers with exclusive access to more than 20 stories per week on upcoming elections, consumer confidence, and issues that affect us all. For those who are really into the numbers, Platinum Members can review demographic crosstabs and a full history of our data.
To learn more about our methodology, click here.