The Only Thing We Have to Fear Is the Other Party
A Commentary By Alan I. Abramowitz and Steven Webster Emory University
How negative partisanship is dividing Americans and shaping the outlook for the 2016 election
Which candidate will emerge from the crowded Republican presidential field next year? Can anyone stop or at least slow down Hillary Clinton’s seemingly inevitable march to the Democratic nomination? Will Democrats be able to match the GOP in Super PAC spending? And will there be new revelations about Clinton’s e-mails or the Clinton Foundation’s fundraising practices?
These are some of the questions that are dominating discussion of the 2016 presidential election in the media and among Washington political insiders. What you need to know is that the answers to these questions, interesting as they might be, will have almost no bearing on the outcome of the 2016 presidential election.
Regardless of whether the Republican nominee is Jeb Bush, Scott Walker, Marco Rubio, or one of the longer-shots in the GOP field, regardless of how many delegates Bernie Sanders or Martin O’Malley manage to win in the Democratic caucuses and primaries, regardless of any new Clinton e-mail or fundraising controversies, and regardless of how many millions of dollars are spent by conservative and liberal Super PACs, the basic contours of the presidential race will not be affected.
The most important influence on the 2016 presidential election as well as the House and Senate elections will be the division of the American electorate into two warring partisan camps. In the seven decades since the end of World War II, Democrats and Republicans have never been as divided as they are today.
The rise of negative partisanship
The 2012 election saw the highest levels of party loyalty and straight-ticket voting since the American National Election Studies began tracking American voting patterns in 1952. Over 90% of Democrats and Republicans, including voters who claimed to be independents but indicated that they leaned toward one party or the other, supported their party’s presidential candidate. Close to 90% supported their party’s House and Senate candidates as well, and 83% cast a straight-party ballot for president, House, and Senate.
There is no reason to expect voting patterns in 2016 to differ from those in 2012. Party loyalty has surged in the American electorate since the 1980s even as the percentage of voters claiming to be independents has risen to a record level. This surge in party loyalty has involved strong identifiers, weak identifiers, and independents who lean toward one of the two parties alike.
These exceptionally high levels of party loyalty and straight-ticket voting combined with increasing reluctance to openly identify oneself as a party supporter reflect a fundamental change in the way Americans relate to the Democratic and Republican parties -- the rise of negative partisanship. A growing number of Americans have been voting against the opposing party rather than for their own party.
Over the past several decades, partisan identities in the United States have become increasingly aligned with other salient social, cultural, and political divisions in American society. Supporters of each party have come to perceive supporters of the opposing party as very different from themselves in terms of their social characteristics, political beliefs, and values, and to hold strongly negative opinions of the opposing party’s elected officials, candidates, and supporters. Negative perceptions of the opposing party are also reinforced by exposure to partisan news sources, which have proliferated in recent years.
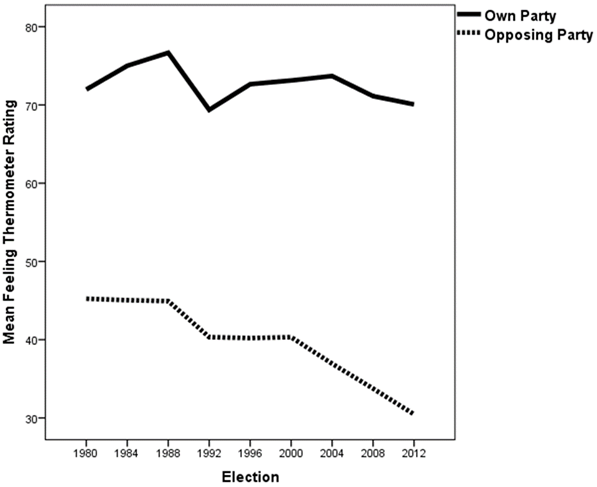
Since 1980, the proportion of party supporters who have strongly negative feelings toward the opposing party has risen sharply. Figure 1 shows the trends in the mean rating by party supporters, including leaning independents, of their own party and the opposing party on a feeling thermometer scale. This is a scale that ranges from zero degrees, the most negative rating, to 100 degrees, the most positive rating. A rating of 50 degrees on the scale is labelled neutral.
Figure 1: Feeling thermometer ratings of own party and opposing party, 1980-2012
Source: American National Elections Study Cumulative File
The results displayed in Figure 1 show that party supporters’ ratings of their own party have changed very little over this time period. The average rating by voters of their own party went from 72 degrees in 1980 to 70 degrees in 2012. In contrast, voters’ feelings toward the opposing party have fallen sharply over this time period. The average rating of the opposing party fell from 45 degrees in 1980 to 30 degrees in 2012. Moreover, this increasing negativity toward the opposing party affected all types of party supporters. Between 1980 and 2012, the mean rating of the opposing party on the feeling thermometer scale fell from 41 degrees to 24 degrees among strong party identifiers, from 47 degrees to 36 degrees among weak party identifiers, and from 48 degrees to 35 degrees among leaning independents.
Today, far larger proportions of Democratic and Republican voters hold strongly negative views of the opposing party than in the past. In 1980, 55% of voters gave the opposing party a neutral or positive rating while only 27% gave the opposing party a rating of 30 degrees or lower. By contrast, in 2012 only 26% of voters gave the opposing party a neutral or positive rating while 56% gave the opposing party a rating of 30 degrees or lower.
For a growing percentage of American voters, negative feelings toward the opposing party outweigh positive feelings toward their own party. Moreover, most of this change has occurred since 2000. Between 2000 and 2012 the proportion of positive partisans -- voters who liked their own party more than they disliked the opposing party -- fell from 61% to 38% while the proportion of negative partisans -- voters who disliked the opposing party more than they liked their own party -- rose from 20% to 42%. This was the first time since the ANES began asking the party feeling thermometer question in 1978 that negative partisans outnumbered positive partisans.
The rise of negative partisanship has influenced feelings about the Democratic and Republican presidential candidates as well. In 1980, 52% of voters gave the opposing party’s presidential candidate a neutral or positive rating, while only 36% gave the opposing party’s candidate a rating of 30 degrees or lower. In 2012, in contrast, only 25% of voters gave the opposing party’s presidential candidate a neutral or positive rating while 60% gave the opposing party’s candidate a rating of 30 degrees or lower.
Implications for 2016
Negative partisanship has been a major contributor to rising levels of party loyalty and straight-ticket voting in recent elections. According to ANES data, in 2012 only 52% of party supporters who rated the opposing party above 50 degrees on the feeling thermometer voted consistently for their own party’s candidates in the presidential, House, and Senate elections. But this group made up only 10% of party supporters. In contrast, 87% of party supporters who rated the opposing party below 50 degrees voted consistently for their own party’s candidates, and this group made up 74% of party supporters.
These trends are almost certain to continue in 2016. If anything, feelings toward the parties and presidential candidates may be even more polarized than in 2012 given the deep divisions between Democrats and Republicans over issues ranging from immigration and health care to climate change and same-sex marriage and the likelihood of hundreds of millions of dollars in spending on attack ads by each side. And while the economy will have an effect on the outcome of the election, that effect is likely to be small unless conditions improve or deteriorate markedly during 2016.
We can predict with a high degree of confidence that party loyalty will be very strong in next year’s elections. The rise of negative partisanship means that very few Republicans or independents who lean toward the Republican Party will vote for Hillary Clinton or any other Democratic presidential candidate in 2016. Likewise, very few Democrats or independents who lean toward the Democratic Party will vote for Jeb Bush, Scott Walker, Marco Rubio, or any of the other potential Republican candidates. “Pure independents,” voters with no partisan preference at all, will probably make up less than 10% of the electorate, and if 2016 is like other recent elections, they will end up splitting their votes fairly evenly between the parties.
Strongly partisan voting patterns mean that we can expect another relatively close election in 2016 with the same set of swing states as in 2012 ultimately deciding the outcome. But they also mean that, given a normal presidential election turnout pattern, the Democratic nominee should have a slight edge simply because voters who identify with or lean toward the Democratic Party will probably outnumber voters who identify with or lean toward the Republican Party.
According to a recent study by the highly respected Pew Research Center based on more than 25,000 interviews with eligible voters, during 2014 Democrats and independents leaning toward the Democratic Party outnumbered Republicans and independents leaning toward the Republican Party by a margin of 48% to 39%. While the Democratic margin is likely to be somewhat smaller among actual voters than among eligible voters, it should still be large enough to give the Democratic candidate an advantage. Moreover, the Democratic margin in leaned party identification could be pushed up a bit by the expected increase in the nonwhite share of the electorate between 2014 and 2016.
Because we can also expect a very high level of straight-ticket voting in 2016, the outcome of the presidential election will have a strong influence on the results of the House and Senate elections. Even with high levels of straight-ticket voting, however, the results of the House and Senate elections will be shaped by the way Democratic and Republican voters are distributed across the 435 House districts and the 34 states holding Senate elections.
In the House elections, Republicans have a significant advantage, partly due to the inefficient distribution of Democratic voters across districts. Democratic voters are heavily concentrated in a relatively small number of districts in large urban areas, which is partly due to gerrymandering by Republican-controlled state legislatures following the 2010 midterm elections. As a result, there are considerably more Republican-leaning districts than Democratic-leaning districts in the nation. In 2012, for example, even though Barack Obama won the national popular vote by about four percentage points, Mitt Romney actually carried 227 House districts to only 208 for Obama. This GOP advantage in district partisanship, combined with the strongly partisan voting patterns in House elections, means that even if Democrats hold the White House in 2016, they are unlikely to pick up enough seats to regain control of the House.
Democrats have a better chance to take back the Senate next year, which would require a net pickup of four or five seats, depending on which party wins the presidential election. None of the 10 Democratic seats that are up for election in 2016 are in states that were carried by Mitt Romney in 2012, while seven of the 24 Republican seats are in states that were carried by Barack Obama. Normal partisan voting patterns in a presidential election year should allow Democrats to pick up a number of those seats.
Conclusion
The rise of negative partisanship has drastically altered the nature of electoral competition in the United States. Intense dislike of the opposing party and its candidates by supporters of both parties means that party loyalty and straight-ticket voting are much more prevalent than in the past. As a result, the outcomes of elections for offices from the presidency down to the state and local level are overwhelmingly determined by the balance of party support in the electorate while local factors such as the records and personalities of the candidates are much less important than in the past.
The rise of negative partisanship in the American electorate appears to be part of a vicious cycle of mutually reinforcing elite and mass behavior. Confrontational politics in Washington and in many state capitols is causing Democratic and Republican voters to develop increasingly negative views of the opposing party and to vote along party lines from the top of the ticket to the bottom. Negative views of the opposing party among voters, in turn, encourage political elites to adopt a confrontational approach to governing. Given these mutually reinforcing patterns of elite and mass behavior, negative partisanship is likely to remain an important feature of American politics for the foreseeable future.
Alan I. Abramowitz is the Alben W. Barkley Professor of Political Science at Emory University and a senior columnist for the Crystal Ball. His most recent book is The Polarized Public: Why American Government Is So Dysfunctional. Follow Alan on Twitter @AlanIAbramowitz.
Steven Webster is a Ph.D. student in the Department of Political Science at Emory University. His research interests include American voting behavior, campaigns and elections, personality and politics, and political psychology. Follow Steven on Twitter at @stevenwwebster.
Courtesy of Larry Sabato's Crystal Ball
See Other Commentary by Dr. Alan Abramowitz
Rasmussen Reports is a media company specializing in the collection, publication and distribution of public opinion information.
We conduct public opinion polls on a variety of topics to inform our audience on events in the news and other topics of interest. To ensure editorial control and independence, we pay for the polls ourselves and generate revenue through the sale of subscriptions, sponsorships, and advertising. Nightly polling on politics, business and lifestyle topics provides the content to update the Rasmussen Reports web site many times each day. If it's in the news, it's in our polls. Additionally, the data drives a daily update newsletter and various media outlets across the country.
Some information, including the Rasmussen Reports daily Presidential Tracking Poll and commentaries are available for free to the general public. Subscriptions are available for $4.95 a month or 34.95 a year that provide subscribers with exclusive access to more than 20 stories per week on upcoming elections, consumer confidence, and issues that affect us all. For those who are really into the numbers, Platinum Members can review demographic crosstabs and a full history of our data.
To learn more about our methodology, click here.


