Both White and Nonwhite Democrats are Moving Left
A Commentary By Alan I. Abramowitz
Race, party, and ideological congruence in the American electorate.
KEY POINTS FROM THIS ARTICLE
— One of the big stories of American politics over the past half-century has been a growing ideological divide between Democrats and Republicans.
— This has also led to more ideological cohesion within parties, including a dramatic increase among Democrats between 2012 and 2020. Democrats are now as ideologically cohesive as Republicans, which is a big change from a decade ago, when Republicans were significantly more cohesive than Democrats.
— While white Democrats have moved more to the left than nonwhite Democrats have on some issues, both groups have become more liberal since 2012.
Ideological congruence in the American electorate
Growing partisan-ideological congruence has been one of the most important trends affecting American politics over the past several decades. The ideological divide between Democrats and Republicans has increased dramatically since the 1970s as Republicans have grown increasingly conservative and Democrats have grown increasingly liberal. This increase in partisan-ideological congruence has affected rank-and-file voters as well as party elites and activists.
In this article, I use data from American National Election Studies surveys to examine trends in partisan-ideological congruence among Democratic and Republican voters since 2012. To measure partisan-ideological congruence, I examine trends in ideological identification and policy preferences among Democrats and Republicans. In addition, I examine whether there is evidence of an emerging ideological divide between white and nonwhite Democratic voters. The findings indicate that from 2012 to 2020, there was a dramatic increase in liberalism among Democratic voters. This leftward shift has been somewhat greater among white Democrats than among nonwhite Democrats. However, both white and nonwhite Democrats moved to the left over that timespan. As a result, for the first time in recent history, partisan-ideological congruence is as great among Democrats as among Republicans. This trend has important implications for voting behavior.
Trends in ideological congruence
The ideological divide between Democratic and Republican voters has been increasing since at least 1972, when the American National Election Studies first included a question measuring ideological identification. The long-term trend is displayed in Figure 1, which includes data for every presidential election between 1972 and 2020. The liberal-conservative scale ranges from 1, the most liberal score, to 7, the most conservative score.
Figure 1: Mean score of Democratic and Republican voters on 7-point liberal-conservative scale, 1972-2020
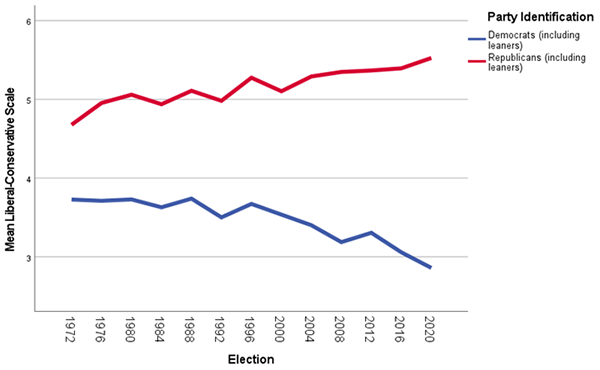
Note: Based on average score of those answering the ideology question. Those opting out of the question are not included.
Source: American National Election Studies Cumulative File
In 1972, supporters of the two parties were separated by an average of one unit on the 1-7 scale. The mean score for Democratic voters was 3.7, just slightly to the left of center, while the mean score for Republican voters was 4.7. By 2020, the distance between supporters of the two parties had increased to an average of 2.6 units. The mean score for Democratic voters was 2.8 while the mean score for Republican voters was 5.5. These were the most extreme average scores for supporters of both parties since the ANES started asking the ideological identification question.
Beyond the long-term trends in ideological identification, the data in Figure 1 indicate that the divide between supporters of the two parties has increased considerably since 2012 and that most of this increase was due to a sharp leftward shift among Democratic voters. Between 2012 and 2020, the mean score for Democratic voters went from 3.3 to 2.9 while the mean score for Republican voters went from 5.4 to 5.5.
In order to understand the significance of this shift in ideological identification over the last 3 elections, I looked at trends in ideological congruence among Democratic and Republican voters on several policy issues in addition to ideological identification. The findings are displayed in Table 1. Ideological congruence is measured by the percentage of Democratic voters taking the liberal position and the percentage of Republican voters taking the conservative position on each issue.
Table 1: Ideological congruence among Democratic and Republican voters, 2012-2020
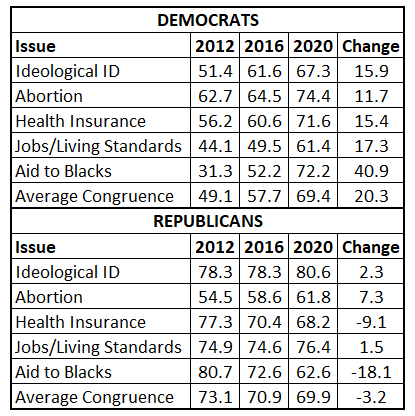
Note: Congruence is defined as the percentage taking liberal position for Democrats and percentage taking conservative position for Republicans among those responding to each question. Respondents opting out of answering are not included.
Source: American National Election Studies Cumulative File
The results in Table 1 show that there was a dramatic increase in liberalism among Democratic voters over this 8-year period. The percentage of Democratic voters taking the liberal position increased by an average of more than 20 percentage points across these five questions, with the largest shift occurring on the issue of government aid to Blacks. In contrast, there was no consistent pattern of change among Republican voters over these 8 years. Republican voters became somewhat more conservative on abortion but considerably less conservative on the aid to Blacks question. A key takeaway comes in Table 1’s “Average Congruence” score — notice that it was almost identical in 2020 for Democrats and Republicans, whereas back in 2012, Republicans had a significantly higher score.
As a result of these shifts in ideological congruence between 2012 and 2020, Democratic voters are now as consistent in their liberalism as Republican voters are in their conservatism. Democrats are still somewhat less likely to identify as liberal than Republicans are to identify as conservative. On some specific policy issues, however, such as abortion and aid to Blacks, Democrats are more likely to take the liberal position than Republicans are to take the conservative position.
A racial divide among Democrats?
The sharp leftward movement among Democratic voters in recent years has led some political observers to suggest that Democrats need to be concerned about a growing racial divide in political ideology. Nonwhites make up a large share of Democratic voters — 43% in 2020 according to the ANES data — and nonwhite Democrats have traditionally been less likely than white Democrats to self-identify as liberal. A growing racial divide in ideology could lead to an erosion in support for Democratic candidates among nonwhites, who have been some of the most loyal Democratic voters.
Table 2: Ideological congruence among white and nonwhite Democratic Voters, 2012-2020
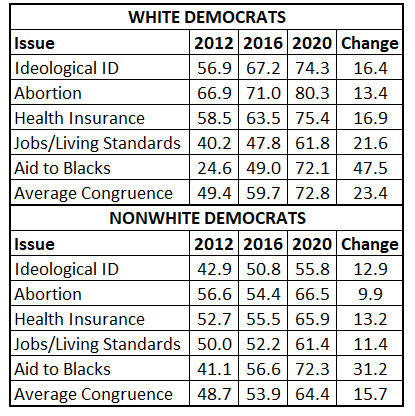
Note: Congruence is defined as the percentage taking liberal position among those responding to each question. Respondents opting out of answering are not included.
Source: American National Election Studies Cumulative File
Table 2 displays data on trends in ideological congruence on liberal-conservative identification and 4 specific policy issues among white and nonwhite Democrats between 2012 and 2020. The evidence in this table shows that there was a large leftward shift among nonwhite as well as white Democrats over these 3 elections. Nonwhite Democrats continue to be somewhat less likely than white Democrats to self-identify as liberal and to support abortion rights. However, they are just as liberal as white Democrats on other issues such as government responsibility for jobs and living standards and aid to Blacks. The most significant trend in attitudes on these issues has been a dramatic shift to the left among white Democrats.
Discussion and implications
Democratic voters moved sharply to the left in their ideological identification and policy preferences on a range of issues between 2012 and 2020. As a result, for the first time since at least 1972, ideological congruence is now as high among Democratic voters as it is among Republican voters. This rise in ideological congruence among Democratic voters — and especially among white Democratic voters — has had important consequences for voting behavior. The data in Figure 2 show that for many years, white Democrats have lagged behind nonwhite Democrats in loyalty to Democratic presidential candidates. In 2020, however, this gap almost disappeared with white Democratic identifiers almost as loyal as nonwhite Democratic identifiers.
Figure 2: Loyalty of white and nonwhite Democratic identifiers in presidential elections, 1972-2020
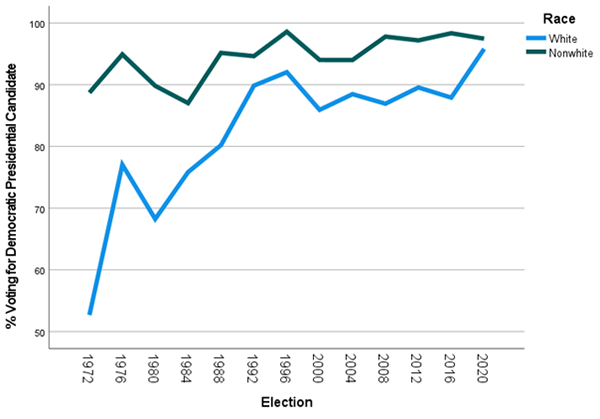
Source: American National Election Studies Cumulative File
The increase in loyalty among white Democratic identifiers is due largely to their increased liberalism because defections among white Democrats have been heavily concentrated among those with relatively conservative ideological orientations. This increased loyalty has also been apparent in other types of elections including those for U.S. Senate and House of Representatives. In 2022, according to data from the American National Election Studies Pilot Survey, 96% of Democratic identifiers, including leaning independents, voted for Democratic candidates for U.S. House and U.S. Senate. Growing ideological congruence among Democrats, and especially among white Democrats, suggests that these high levels of loyalty are likely to continue in 2024 and beyond.
Alan I. Abramowitz is the Alben W. Barkley Professor of Political Science at Emory University and a senior columnist with Sabato’s Crystal Ball. His latest book, The Great Alignment: Race, Party Transformation, and the Rise of Donald Trump, was released in 2018 by Yale University Press. |
|
See Other Commentary by Dr. Alan Abramowitz.
See Other Political Commentary.
Views expressed in this column are those of the author, not those of Rasmussen Reports. Comments about this content should be directed to the author or syndicate.
Rasmussen Reports is a media company specializing in the collection, publication and distribution of public opinion information.
We conduct public opinion polls on a variety of topics to inform our audience on events in the news and other topics of interest. To ensure editorial control and independence, we pay for the polls ourselves and generate revenue through the sale of subscriptions, sponsorships, and advertising. Nightly polling on politics, business and lifestyle topics provides the content to update the Rasmussen Reports web site many times each day. If it's in the news, it's in our polls. Additionally, the data drives a daily update newsletter and various media outlets across the country.
Some information, including the Rasmussen Reports daily Presidential Tracking Poll and commentaries are available for free to the general public. Subscriptions are available for $4.95 a month or 34.95 a year that provide subscribers with exclusive access to more than 20 stories per week on upcoming elections, consumer confidence, and issues that affect us all. For those who are really into the numbers, Platinum Members can review demographic crosstabs and a full history of our data.
To learn more about our methodology, click here.