Voters Strongly Reject Letting Illegal Immigrants Vote
A proposal has been made in New York City to allow illegal immigrants to vote for mayor and other top city officials. But voters continue to strongly oppose allowing illegal immigrants to vote at all and adamantly reject a plan like the one in New York City for their hometown.
Seventy-one percent (71%) of Likely U.S. Voters oppose letting illegal immigrants vote for local officials in the area where they live. A new Rasmussen Reports national telephone survey finds that just 19% favor such a proposal, while 10% are undecided. (To see survey question wording, click here.)
Sixty-seven percent (67%) say illegal immigrants should not be allowed to vote even if they can prove that they live in this country and pay taxes. That’s up from 60% when Rasmussen Reports first asked this question in May of last year. Twenty-six percent (26%) still believe tax-paying illegal immigrants should be permitted to vote, down from 35%.
Republicans (80%) and voters not affiliated with either of the major political parties (70%) are even more opposed to illegal immigrants voting than there were last year. But now most Democrats agree. Last May, Democrats by a 53% to 42% margin were in favor of allowing tax-paying illegal immigrants to vote. Now, those numbers are reversed, with voters in President Obama’s party opposed by a 52% to 39% margin.
Most voters across the partisan spectrum also oppose the New York City proposal, although again Republicans (86%) and unaffiliated voters (71%) are more strongly opposed than Democrats (57%) are.
(Want a free daily email update? If it's in the news, it's in our polls). Rasmussen Reports updates are also available on Twitter or Facebook.
The survey of 1,000 Likely Voters was conducted on March 2-3, 2016 by Rasmussen Reports. The margin of sampling error is +/- 3 percentage points with a 95% level of confidence. Field work for all Rasmussen Reports surveys is conducted by Pulse Opinion Research, LLC. See methodology.
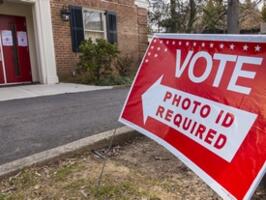
Most voters still think their fellow Americans need to prove their identity before voting and don’t believe photo ID laws discriminate against some voters.
Majorities of voters across nearly all demographic categories oppose letting illegal immigrants vote, especially in the area where they live.
Women and those under 40 are more supportive of allowing illegal immigrants to vote than men and older voters are.
Interestingly, most black and other minority voters oppose allowing illegal immigrants to vote for local officials where they live, but they’re almost evenly divided when it comes to the idea of illegal immigrants in general voting. Roughly three-out-of-four whites are opposed in both cases.
Among those who believe voters should be required to show photo identification before casting their ballot, 77% oppose allowing illegal immigrants to vote. Just 47% of those who oppose a photo ID requirement agree.
Thirty percent (30%) of all voters think it’s already too easy to vote in the United States, while just 19% say it’s too hard. A plurality (46%) thinks the level of difficulty is about right. Just over half of voters oppose an automatic voter registration plan for their state like one recently proposed in Maryland.
Most voters continue to favor stricter border control over granting legal status to those already here illegally and believe amnesty will just encourage more illegal immigration.
Most also still believe the federal government is not interested in stopping illegal immigration, and support for state rather than federal enforcement of immigration laws is now at its highest level in several years.
Additional information from this survey and a full demographic breakdown are available to Platinum Members only.
Please sign up for the Rasmussen Reports daily email update (it's free) or follow us on Twitter or Facebook. Let us keep you up to date with the latest public opinion news.
The survey of 1,000 Likely Voters was conducted on March 2-3, 2016 by Rasmussen Reports. The margin of sampling error is +/- 3 percentage points with a 95% level of confidence. Field work for all Rasmussen Reports surveys is conducted by Pulse Opinion Research, LLC. See methodology.
Related Articles


If it's in the News, it's in our Polls. Public opinion polling since 2003.
 What America Thinks: Voters Vote on Voting
Rasmussen Reports is a media company specializing in the collection, publication and distribution of public opinion information.
We conduct public opinion polls on a variety of topics to inform our audience on events in the news and other topics of interest. To ensure editorial control and independence, we pay for the polls ourselves and generate revenue through the sale of subscriptions, sponsorships, and advertising. Nightly polling on politics, business and lifestyle topics provides the content to update the Rasmussen Reports web site many times each day. If it's in the news, it's in our polls. Additionally, the data drives a daily update newsletter and various media outlets across the country.
Some information, including the Rasmussen Reports daily Presidential Tracking Poll and commentaries are available for free to the general public. Subscriptions are available for $4.95 a month or 34.95 a year that provide subscribers with exclusive access to more than 20 stories per week on upcoming elections, consumer confidence, and issues that affect us all. For those who are really into the numbers, Platinum Members can review demographic crosstabs and a full history of our data.
To learn more about our methodology, click here.