Putting Their Eggs in the Wrong Midterm Basket
A Commentary By Geoffrey Skelley
Why Democrats’ increased reliance on young voters may lead them to struggle in midterm elections in the near future
Barring significant changes in group voting habits, many commentators have argued that “The Coalition of the Ascendant” is positioned to give Democrats a notable edge in elections in the near future. There may be some truth to that supposition: The country is clearly getting more diverse, and nonwhite voters tend to vote strongly Democratic.
A key cog in this coalition has been young voters -- often called Millennials -- who are more diverse than their elders. Exit poll data in 2012 suggest that young people were vital in securing President Barack Obama’s second term in the White House. He garnered 60% of the 18-to-29 vote (after winning 66% of it in 2008), by far the highest percentage Obama won among any age group. Estimating from exit poll data, all else equal, it’s possible that Obama would have narrowly lost the popular vote (and perhaps the Electoral College vote, too) had he won the same percentage among 18-to-29 year olds as he did among 30-to-44 year olds (52%). Continued strong support for Democratic presidential candidates in the future among younger voters could spell trouble for the GOP as generational replacement occurs (yes, that’s a euphemism).
However, one aspect of this trend is anything but rosy for Democrats: Since the first national exit poll was taken for a midterm election in 1978, only once (in that first survey) has the 18-to-29 age group made up a larger portion of a midterm electorate than voters who were 60 or older. And not only have young people almost always been the smallest part of midterm electorates in this period, their participation has usually been much smaller compared to presidential years. With Democrats more reliant on young voters to win elections, drop-off among that group could make it harder for Democrats to find success in midterm cycles.
Why is increased reliance on younger voters a potentially fraught strategy? First, consider recent voting habits by age group. As shown below in Figure 1, in the Age of Obama, the older the voter, the more likely that voter is to vote Republican; the younger the voter, the more likely that voter is to vote Democratic.
Figure 1: Voting by age group, 2012 national exit poll
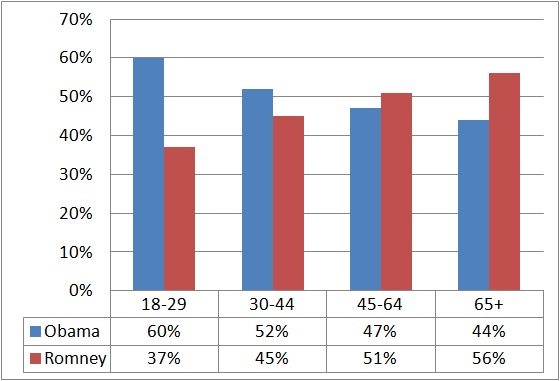
Source: CNN
This age pattern continued in 2010, when in House races Republicans won 59% of voters 65 or older, 53% of 45-to-64 year olds, 50% of 30-to-44 year olds and just 42% of those under 30. Looking back, the positive correlation streak between increased age and increased Republican voting started in the 2006 midterm cycle, at least when the electorate is grouped into four age cohorts.
Prior to 2006, this trend did not necessarily hold true. For instance, in the 2004 presidential election, more 45-to-59 year olds supported Democrat John Kerry than did 30-to-44 year olds. In fact, looking back in time, there has been some variation in the order of age group-level support for the two major parties in both presidential and congressional elections. As shown in Figures 2 and 3 below, while the youngest voters have typically been more Democratic in their leanings, they have not been the most Democratic age group in every election since 1972.
Figures 2 and 3: Democratic two-party vote by age group in presidential and congressional elections, 1972-2010 exit polls
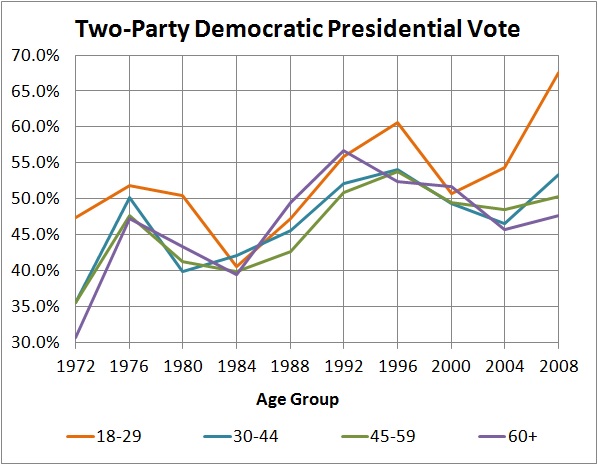

Source: Exit Polls: Surveying the American Electorate, 1972-2010
Note: Because published 2012 exit poll data grouped ages 18-29, 30-44, 45-64 and 65 or older, complete 2012 data is unavailable for the same age groupings as presented above. The raw data from the 2012 exit poll hasn’t yet been made available for researchers to potentially overcome this issue.
Although the pattern hasn’t always held true that older voters will vote more Republican, it doesn’t appear to be a trend that’s going away in the near future. The country is increasingly polarized, partially because of the large gap in policy and political preferences between white and nonwhite voters. Nonwhite voters overwhelmingly support Democrats and most of their policy positions -- Obama won over 80% of the nonwhite vote in 2012 -- while white voters tend to back Republicans and more of their policy positions -- Romney won 59% of the white vote in 2012.
According to the most recent census estimates, 75% of those 50 or older in the United States are non-Hispanic whites, while just 57% under the age of 50 are. Members of the older generations are now almost all at least 50 years old, and because the Silent Generation (born from 1928 to 1945) and the Baby Boomers (born from 1946 to 1964) are predominantly white, they are more likely to vote Republican in our present political climate. Meanwhile, Generation X (born from 1965 to 1980) and particularly the Millennials (born from 1981 on) are far more diverse in their makeup, leaving them more likely to vote Democratic. (The beginning and end dates of some generational groups are up for debate, but the parameters used here are based on those found in The Next America by Paul Taylor and the Pew Research Center, a highly recommended read.)
For the time being, this political generation gap spells trouble for Democrats in midterm elections. Look at Tables 1 and 2 below: On average, the youngest cohort of voters made up just over one-fifth of presidential electorates from 1972 to 2008, but only about 14% of midterm electorates. Younger voters have consistently shown up in smaller numbers in midterm cycles. Not once have 18-29s made up a larger portion of the electorate in a midterm election than they did in the prior or subsequent presidential election since midterm exit polling began in 1978.
Tables 1 and 2: Age composition of electorate in presidential and midterm elections, 1972-2010 exit polls
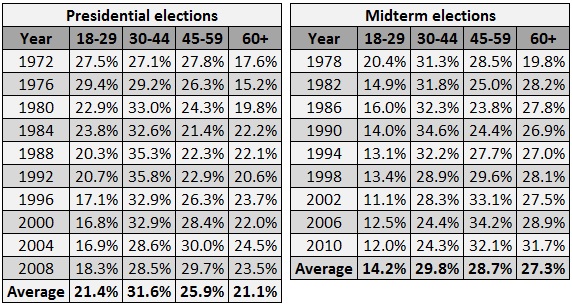
Source: Exit Polls: Surveying the American Electorate, 1972-2010
Note: Because published 2012 exit poll data grouped ages 18-29, 30-44, 45-64 and 65 or older, complete 2012 data is unavailable for the same age groupings as presented above. The raw data from the 2012 exit poll hasn’t yet been made available for researchers to potentially overcome this issue.
Given the time period under examination, it’s unsurprising that younger voters have been turning out in smaller numbers than older voters, especially in recent years. The population is getting older -- the nation’s median age rose from 28.1 in 1970 to 32.9 in 1990 to 37.2 in 2010 -- so, naturally, older voters make up a greater share of the electorate. Still, sharply lower young voter participation in midterm elections is surely a trend that predates national exit polls. Older people are simply more likely to vote in general due to a number of lifestyle factors, such as buying a house, starting a family and becoming settled in a community. Even when the 18-to-29 cohort made up a plurality (30.4%) of the country’s adult population in 1980 (the last time that was true as the Baby Boomers got older), the 1982 midterm election saw an eight-point drop in that group’s portion of the electorate from the 1980 presidential election, falling from 22.9% to 14.9%.
Corresponding to the serious drop-off among younger voters is the increased influence of older voters in midterm electorates. While the number of voters drops precipitously from presidential to midterm elections among all age groups, older voters see a smaller drop-off relative to younger ones. Take a look at Figure 4 below, which presents the data in Tables 1 and 2 in a visual format.
Figure 4: Age composition of electorate in presidential and midterm elections, 1972-2010 exit polls
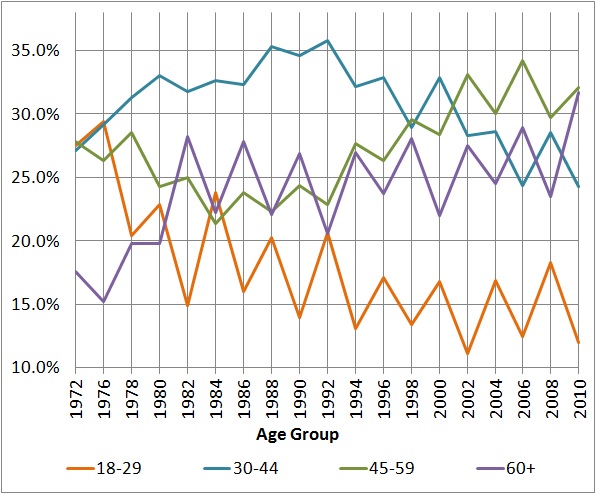
Source: Exit Polls: Surveying the American Electorate, 1972-2010
Note: Because published 2012 exit poll data grouped ages 18-29, 30-44, 45-64 and 65 or older, complete 2012 data is unavailable for the same age groupings as presented above. The raw data from the 2012 exit poll hasn’t yet been made available for researchers to potentially overcome this issue.
The glaringly obvious trend in Figure 4 is the inverse relationship between the 18-to-29 and 60+ cohorts. Every presidential election, the size of the 18-to-29 portion of the electorate increases sharply while the 60+ portion of the electorate decreases markedly. Every midterm election, the opposite happens because elderly voters are more likely to cast votes in both presidential and midterm years than their younger counterparts. It’s also worth noting the movement of the Baby Boomer generation through the different age groups. As a large majority or entirety of the 18-to-29 cohort in the electorates between 1972 through 1984, the Baby Boomers explain to some degree why there was higher participation by younger voters as a proportion of the electorate. In the meantime, the older Boomers entered the 30-to-44 age range, causing it to increase as well. That cohort spiked in participation in 1992, when Boomers made up 100% of it. From there, the 45-to-59 group increased in size as the Boomers aged further.
While one of the two certainties in life -- death (the other being taxes) -- will always to some degree restrict the size of the oldest voting group, improved health care and longer lifespans mean that more elderly voters will be around to make their voices heard in the future. And because of the Baby Boomers, we can expect there to be a lot of elderly voters: 10,000 people will turn 65 every day between now and 2030, according to Taylor’s aforementioned The Next America. If recent voting trends continue, a majority of these individuals may well vote Republican in upcoming elections. As older people are more likely to vote, these voters will continue to have outsized influence in midterm contests where young voters are less likely to turn out on Election Day, to the potential benefit of Republicans in our present political environment.
This midterm drop-off among young voters is a serious problem for Democrats. While Obama’s reelection in 2012 proved that Democrats can make up ground with strong support from the youngest voting cohort, the party could not turn those supporters out in 2010 and probably won’t be able to in 2014 either, given the historical pattern. That said, Democrats can obviously still do well in midterm years: For instance, a 2006-style electoral atmosphere, in which a deeply unpopular Republican president dragged his party down in a sixth-year midterm, will almost always work out in Democrats’ favor, no matter the demographics. But in a neutral midterm environment, and particularly a poor one like 2010, Democrats’ reliance on younger voters could hinder their efforts to win seats in the U.S. Senate, U.S. House, many state legislatures and the vast majority of governorships that are chosen in midterm cycles.
While get-out-the-vote strategists might think otherwise, the only practical solution to this problem for Democrats may be Father Time: Like all those who have aged before them, as Millennials get older they will become more consistent voters. Democrats will just have to hope that they remain as strongly Democratic in their voting habits as they have proven to be over the last few years, somewhat like members of the Greatest Generation (born before 1928), who came of age during the New Deal and remained more reliable Democratic voters than their younger counterparts even into their twilight years.
Geoffrey Skelley is the Associate Editor at the Center for Politics at the University of Virginia.
See Other Political Commentary by Geoffrey Skelley
See Other Political Commentary
Views expressed in this column are those of the author, not those of Rasmussen Reports. Comments about this content should be directed to the author.
Related Articles

Rasmussen Reports is a media company specializing in the collection, publication and distribution of public opinion information.
We conduct public opinion polls on a variety of topics to inform our audience on events in the news and other topics of interest. To ensure editorial control and independence, we pay for the polls ourselves and generate revenue through the sale of subscriptions, sponsorships, and advertising. Nightly polling on politics, business and lifestyle topics provides the content to update the Rasmussen Reports web site many times each day. If it's in the news, it's in our polls. Additionally, the data drives a daily update newsletter and various media outlets across the country.
Some information, including the Rasmussen Reports daily Presidential Tracking Poll and commentaries are available for free to the general public. Subscriptions are available for $4.95 a month or 34.95 a year that provide subscribers with exclusive access to more than 20 stories per week on upcoming elections, consumer confidence, and issues that affect us all. For those who are really into the numbers, Platinum Members can review demographic crosstabs and a full history of our data.
To learn more about our methodology, click here.