Biden’s Support Among Democrats May Be Exaggerated
A Commentary By Doug Johnson Hatlem
A strong plurality of voters, 8% to12% more than prefer former Vice President Joe Biden first, are undecided ahead of the 2020 Democratic primary, according to a YouGov Blue poll fielded and released after Biden’s entry into the race.
YouGov’s partner, Data for Progress, helpfully took the rare step of releasing the raw data for the poll when it was published online at Rolling Stone last week. Dem primary voters with no first choice made up 33.8% in the raw sample, 30% as I have weighted the poll to match age, gender and race/ethnicity data from the 2016 Democratic primary.* Meanwhile, just 21.4% in the raw sample, 22.4% by my weighting, selected Biden first.
A number of other polls have put Democratic undecided figures between 20% and 35% over the last month: USC (27%), Monmouth (20%), Ipsos/Reuters (21%) and ABC/Washington Post (35%), all nationally, and then the state polls from Suffolk in New Hampshire (27%), Firehouse/Øptimus in South Carolina (20%) and Tel Opinion Research in Florida (28%).
Several polling firms simply do not report undecideds, culling them from the sample before reporting on decided voters, while others press initially undecided respondents hard for which way they are leaning. CNN (7%) and Quinnipiac (8%) represent the very lowest end of those reporting undecided numbers.
The last Rasmussen Reports poll (January 28-29) to ask Democratic voters likely to vote in the 2020 primary which prominent Democrat would make the best candidate against Trump found that 39% supported Biden while 22% were unsure. (full results available to Platinum Subscribers).
As I have argued previously in accurately projecting the 2017 United Kingdom general election, undecided voters matter enormously. Simply excluding them, particularly when they are large in number, is a way to artificially boost the leading candidate or party.
YouGov Blue prompted respondents to select all candidates they are considering with their vote, then to rank them, and also to indicate any candidates they would not consider. Biden’s support, not excluding undecideds, jumped to 25.4% among people of color/Hispanic voters. This is still a far cry from figures for Biden in the upper 30s to mid-40s as reported in many recent polls, including support from as many as 50% of non-white voters in a recent CNN/SSRS national sample.
In the data set including undecideds from YouGov Blue, women of color, often said to be the backbone of the Democratic party, were even more undecided than the 30% in the full sample – 45 of 110 (41%) not yet having a first choice and just 26 (24%) selecting Biden.
Vermont Senator Bernie Sanders was selected as the first choice by 10.7% in the raw YouGov data, 11.5% in my topline, and Senator Elizabeth Warren of Massachusetts came third in both the raw sample (9.9%) and in my re-weighting (also 9.9%).
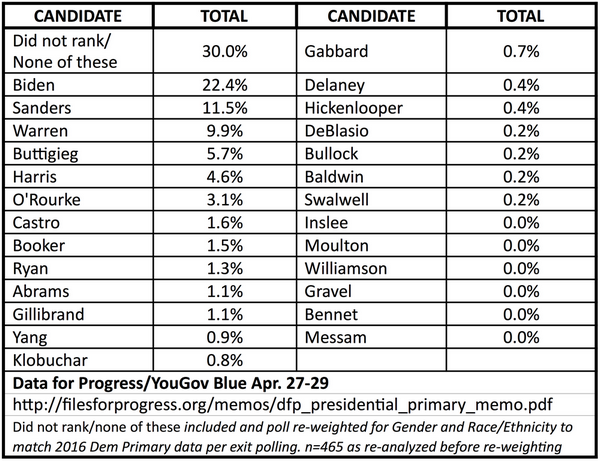
As weighted by Data for Progress, with undecideds simply excluded, Biden led with 33%, followed by Sanders (17%), Warren (16%), South Bend Mayor Pete Buttigieg (9%), California Senator Kamala Harris (7%) and failed Texas Senate candidate Beto O’Rourke (4%), with 13% selecting someone else.
Pundits of a wide range of data literacy previously thought Biden and Sanders would easily be surpassed as name recognition increased for candidates with lesser support. That has not happened, and many of those same pundits now seem prepared to declare Biden nearly impossible to catch for the remaining candidates. Does he have a 10% lead over Sanders (my topline), a 16% lead (Data for Progress’ figures), or does Biden have a nearly insurmountable lead as in the latest Harvard-Harris (30%) and Hill/HarrisX (32%) releases?
***
The fundamental fault lines in the 2016 Democratic primary were around race/ethnicity, age, and to a lesser extent gender. Clinton won big with non-white voters, especially older black women, while Sanders won big with younger voters, including young women. With young voters of color, Sanders likely had a small edge over Clinton.
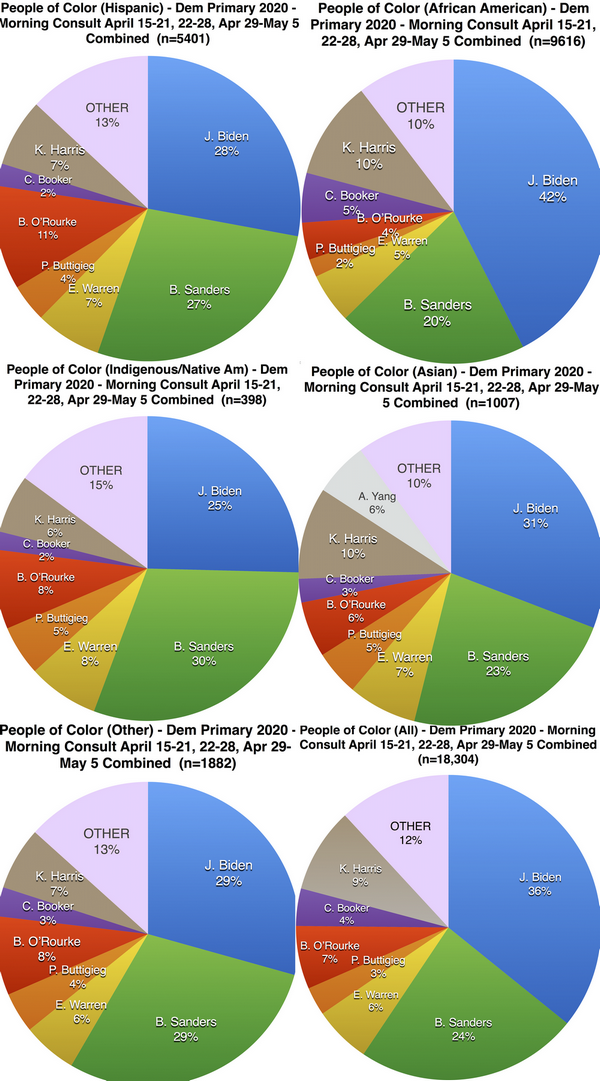
Morning Consult has sent me the detailed data tables from three weeks of their large-sample-sized weekly updates for the Democratic primary. The data covers April 15 to May 5, with respondents from approximately half before and half after Biden’s announcement. Unlike CNN’s 36% advantage among non-white voters for Biden, based on a sample size under 200, more than 18,000 decided or leaning non-white voters reached by Morning Consult favored Biden by just 12% over Sanders. While Biden enjoyed a much larger lead of 22% over that three-week period among African American respondents (similar to the most recent Morning Consult overall lead of 20%), he led by just one percent (1%) with Hispanic Democratic primary respondents.
All of this would suggest that Biden’s lead in the Democratic primary has been greatly exaggerated by artificial exclusion of undecided voters, small sample sized polls that are off base with respect to non-white voters, not to mention age, and, where we have data on this from Monmouth and YouGov, a respondent pool much more favorable to Clinton in 2016 vote report than was the actual gap between her and Sanders.
Emerson Polling, which excludes undecided respondents from its release but reports how its respondents voted in the 2016 Dem primary and has a sample that accurately reflects the results of that contest, released a poll Monday evening. It shows just an eight percent (8%) lead for Biden over Sanders, with Warren and Harris at 10% each, 15% behind Sanders.
In that case, Sanders is wise to continue with his campaign’s strategy of working to register and motivate younger and undecided voters instead of giving in to panic over polls like the most recent from New Hampshire by Monmouth showing an 18% lead for Biden but greatly over weighting voters 50-years-old and older.
*The design effect for the sample as a whole as re-weighted for gender is 1.13 ranging up to 1.55 for two smaller categories with an undersample, 18-29-year-olds and non-white males plus white males of Hispanic ethnicity . Final exit polling numbers for the 2016 Democratic primary can be found by state (where they were taken) at CNN’s website or as aggregated by Gary Langer at ABC’s website or by Public Opinion Strategies in the Wall Street Journal. To obtain the raw data, scroll to the bottom of the Rolling Stone article linked above. All respondents were registered voters; 94% said they were likely or certain to vote in the 2020 Democratic primary or caucus in their state, and all but seven of those who said “maybe” to voting in the 2020 Dem primary voted in the 2018 midterms.
Doug Johnson Hatlem writes on polling, elections data, and politics. For questions, comments, or to inquire about syndicating this weekly column for the 2020 cycle in your outlet, he can be contacted on Twitter @djjohnso (DMs open) or at djjohnso@yahoo.com (subject line #10at10 Election Column).
See Other Political Commentaries.
Views expressed in this column are those of the author, not those of Rasmussen Reports. Comments about this content should be directed to the author or syndicate.
Related Articles
Rasmussen Reports is a media company specializing in the collection, publication and distribution of public opinion information.
We conduct public opinion polls on a variety of topics to inform our audience on events in the news and other topics of interest. To ensure editorial control and independence, we pay for the polls ourselves and generate revenue through the sale of subscriptions, sponsorships, and advertising. Nightly polling on politics, business and lifestyle topics provides the content to update the Rasmussen Reports web site many times each day. If it's in the news, it's in our polls. Additionally, the data drives a daily update newsletter and various media outlets across the country.
Some information, including the Rasmussen Reports daily Presidential Tracking Poll and commentaries are available for free to the general public. Subscriptions are available for $4.95 a month or 34.95 a year that provide subscribers with exclusive access to more than 20 stories per week on upcoming elections, consumer confidence, and issues that affect us all. For those who are really into the numbers, Platinum Members can review demographic crosstabs and a full history of our data.
To learn more about our methodology, click here.