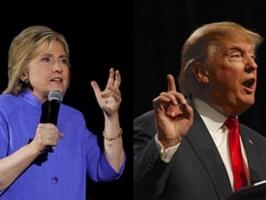
Hillary Meter: It’s Clinton’s Race Now
Following big primary wins on Tuesday, Democrats are more certain than ever that Hillary Clinton will be their party’s presidential nominee this November.
The latest Rasmussen Reports monthly Hillary Meter finds that 89% of Likely Democratic Voters think Clinton is likely to be their party’s presidential nominee in 2016. That includes 60% who say it is Very Likely, up 17 points from last month just after the Iowa caucus and New Hampshire primary. This is the highest number of Democrats who consider Clinton’s nomination Very Likely in monthly surveys since July. Just nine percent (9%) now feel the former secretary of State is not very or Not At All Likely to win the nomination. (To see survey question wording, click here.)
The latest survey was conducted the night prior to and the night of Clinton’s primary wins in Florida, Ohio, Illinois and North Carolina.
Among all Likely Voters, 80% believe Clinton is the likely Democratic nominee, with 49% who say it is Very Likely. The latter finding is down slightly from 52% in the previous survey. Just 15% of voters disagree.
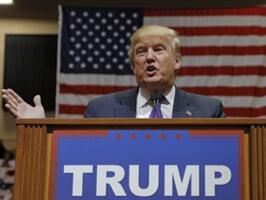
By comparison, our latest weekly Trump Change survey finds that 80% of Likely Republican Voters – and 74% of all voters – think Donald Trump will be the GOP nominee next year. We’ll release new numbers tomorrow and see how Trump’s multiple primary wins on Tuesday impact voter perceptions of his chances.
(Want a free daily email update? If it's in the news, it's in our polls). Rasmussen Reports updates are also available on Twitter or Facebook.
The survey of 1,000 Likely Voters was conducted on March 14-15, 2016 by Rasmussen Reports. The margin of sampling error is +/- 3 percentage points with a 95% level of confidence. Field work for all Rasmussen Reports surveys is conducted by Pulse Opinion Research, LLC. See methodology.
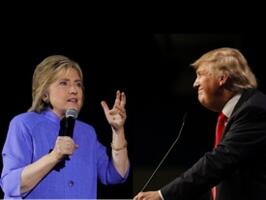
Most voters already say a choice between Trump and Clinton is not one they are particularly excited about. More voters say they will vote against Clinton and Trump than will vote for them.
Fifty-eight percent (58%) of all voters believe Clinton in political terms is a liberal. Twenty-nine percent (29%) say she is a moderate, while just six percent (6%) describe her as conservative. These findings have changed little from past surveys, but in Rasmussen Reports’ first Hillary Meter – in April 2005 during her last run for the presidency - 43% said Clinton was liberal, 34% moderate and eight percent (8%) conservative.
Among Democrats, just 35% consider Clinton politically liberal; 48% think she’s moderate and 10% conservative. Seventy-seven percent (77%) of Republicans and 64% of voters not affiliated with either major party say Clinton is a liberal.
Forty-eight percent (48%) of Republican voters say it’s Very Likely Clinton will end up the nominee, a view shared by 38% of unaffiliated voters. That compares to 26% and 27% respectively last month.
More than 50% of those 40 and older say a Clinton nomination is Very Likely, a view shared by just 42% of younger voters.
Blacks feel more strongly than whites and other minority voters that Clinton is Very Likely to be the nominee.
A survey conducted in late February found Clinton leadinging fading Democratic rival Bernie Sanders 53% to 31% nationally among Democrats.
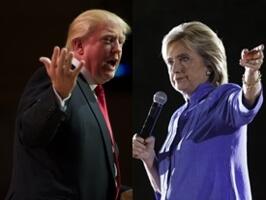
When it comes to which front-runner voters trust more on key issues, Trump leads when it comes to the economy, job creation and immigration. Clinton has held her lead on social issues but has widened her advantage on the environment. The two are virtually tied now when voters are asked whom they trust more to handle national security.
Clinton has now moved ahead of Trump in our latest hypothetical presidential matchup.
Additional information from this survey and a full demographic breakdown are available to Platinum Members only.
Please sign up for the Rasmussen Reports daily email update (it’s free) or follow us on Twitter or Facebook. Let us keep you up to date with the latest public opinion news.
The survey of 1,000 Likely Voters was conducted on March 14-15, 2016 by Rasmussen Reports. The margin of sampling error is +/- 3 percentage points with a 95% level of confidence. Field work for all Rasmussen Reports surveys is conducted by Pulse Opinion Research, LLC. See methodology.
Related Articles
Rasmussen Reports is a media company specializing in the collection, publication and distribution of public opinion information.
We conduct public opinion polls on a variety of topics to inform our audience on events in the news and other topics of interest. To ensure editorial control and independence, we pay for the polls ourselves and generate revenue through the sale of subscriptions, sponsorships, and advertising. Nightly polling on politics, business and lifestyle topics provides the content to update the Rasmussen Reports web site many times each day. If it's in the news, it's in our polls. Additionally, the data drives a daily update newsletter and various media outlets across the country.
Some information, including the Rasmussen Reports daily Presidential Tracking Poll and commentaries are available for free to the general public. Subscriptions are available for $4.95 a month or 34.95 a year that provide subscribers with exclusive access to more than 20 stories per week on upcoming elections, consumer confidence, and issues that affect us all. For those who are really into the numbers, Platinum Members can review demographic crosstabs and a full history of our data.
To learn more about our methodology, click here.