What They Told Us: Reviewing Last Week’s Key Polls - Week Ending January 25, 2020
In surveys last week, this is what America told Rasmussen Reports...
Search for "January 6"
Site search returned 236 matches
Sort results by

In surveys last week, this is what America told Rasmussen Reports...

The Rasmussen Reports Immigration Index for the week of January 19-23, 2020 is at 102.7, up from 100.5 the week before.

In surveys last week, this is what America told Rasmussen Reports...

The Rasmussen Reports Immigration Index for the week of January 12-16, 2020 is at 100.5, up from 99.7 the week before.

In surveys last week, this is what America told Rasmussen Reports...

The Rasmussen Reports Immigration Index for the week of January 5-9, 2020 is at 99.7, up slightly from 98.4 the week before.

The Rasmussen Reports Immigration Index for the week of December 29, 2019 through January 4, 2020 is at 98.4, down from 100.1 the week before.

In surveys last week, this is what America told Rasmussen Reports...

In surveys last week, this is what America told Rasmussen Reports...

In surveys last week, this is what America told Rasmussen Reports...

The tug of war for and against continued funding for the wall along the Mexican border led to a second missed paycheck yesterday for furloughed federal workers.

To quote the Bard, the Trump vs. Pelosi show is “full of sound and fury, signifying nothing.” So the partial government shutdown enters a record-breaking fifth week.

The partial government shutdown enters day 22 and record territory today over the inability of President Trump and Democratic representatives to come to an agreement over funding for a Mexican border wall while the president mulls the possible declaration of a national emergency to fulfill his campaign promise.

Remember Obamacare? The fight is far from over on the future of the Obama-era health insurance overhaul. Republicans are making a last-ditch effort this year to turn the program and the money over to the state. This isn't full Obamacare repeal, but it would make a world of sense. States would be free to experiment and find ways to reduce costs and provide better services.
What to make of the results of the first two of this spring's special House elections? Start off by putting them in perspective. They pose a challenge to both political parties, but especially to Republicans, who have been used to an unusually stable partisan alignment, an alignment that has become scrambled by Donald Trump.

President-elect Donald Trump’s inauguration is still one day away, even though he officially won the presidency more than two months ago. But voters don’t seem to mind the wait.
A post-convention bounce appears to have given Democratic presidential nominee Hillary Clinton her biggest lead over Republican rival Donald Trump since June in our latest weekly White House Watch survey. This is the first update that includes both the Libertarian and Green Party candidates.

Voters give mixed marks to this year’s primaries and candidate debates, but a sizable number say they’ve changed horses since the first of the year.
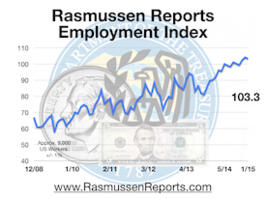
The Rasmussen Employment Index which measures worker confidence slipped a point in January following two months in a row of six-year highs.
At 103.3, worker confidence is down from December’s 104.2. The index fell to a recent low of 81.2 in October 2013 but gained steadily after that. After the Wall Street meltdown in the fall of 2008, the index fell dramatically, hitting an all-time low of 57.8 in July 2009.
(Want a free daily e-mail update? If it's in the news, it's in our polls). Rasmussen Reports updates are also available on Twitter or Facebook.
The survey of 9,364 working Americans was conducted in January 2015 by Rasmussen Reports. The margin of sampling error is +/- 1 percentage points with a 95% level of confidence. Field work for all Rasmussen Reports surveys is conducted by Pulse Opinion Research, LLC. See methodology.

When tracking President Obama’s job approval on a daily basis, people sometimes get so caught up in the day-to-day fluctuations that they miss the bigger picture. To look at the longer-term trends, Rasmussen Reports compiles the numbers on a full-month basis, and the results can be seen in the graphics below.
The president earned a monthly job approval of 49% in January. That’s up a point from December and up two points from the three months prior. It also ties Obama’s high for 2014 reached in February and May. His monthly approval hit a two-year low of 45% in November 2013 during the troubled rollout of the new national health care law.
(Want a free daily e-mail update? If it's in the news, it's in our polls). Rasmussen Reports updates are also available on Twitter or Facebook.
Daily tracking results are collected via telephone surveys of 400 likely voters per night. The monthly numbers in this article are based on approximately 12,000 interviews each month with likely voters. The margin of sampling error is less than +/- 1 percentage points with a 95% level of confidence.