
If it's in the News, it's in our Polls. Public opinion polling since 2003.

General Politics

Most Recent Releases

November 4, 2013

35% Think U.S. Elections Are Fair

Fewer voters than ever think U.S. elections are fair, with just one-in-10 who now believe members of Congress get reelected because of the good job they do.

A new Rasmussen Reports national telephone survey finds that only 35% of Likely U.S. Voters now think American elections are fair to voters, down from August’s previous low of 39% which marked the first time that number had fallen below 40%. Prior to that, it had run in the 40s to low 50s in surveys since September 2004. Nearly half of voters (47%) think American elections are unfair, the highest negative finding in nine years of polling. Eighteen percent (18%) are undecided. (To see survey question wording, click here.)

(Want a free daily e-mail update? If it's in the news, it's in our polls). Rasmussen Reports updates are also available on Facebook.

The survey of 1,000 Likely Voters was conducted on October 30-31, 2013 by Rasmussen Reports. The margin of sampling error is +/- 3 percentage points with a 95% level of confidence. Field work for all Rasmussen Reports surveys is conducted by Pulse Opinion Research, LLC. See methodology.

November 4, 2013

36% Favor A Stop and Frisk Law Where They Live

Just over one-out-of-three voters favor a stop and frisk law like New York City’s and think such a law actually fights crime.

The New York City law allows police to stop and frisk anyone on the street whom they consider suspicious, but 50% of Likely U.S. Voters oppose having a stop and frisk law where they live. A new Rasmussen Reports national telephone survey finds that 36% favor such a law, while 13% are undecided. (To see survey question wording, click here.)

(Want a free daily e-mail update? If it's in the news, it's in our polls).  Rasmussen Reports updates are also available on Twitter or Facebook.

The national survey of 1,000 Likely Voters was conducted on November 1-2, 2013 by Rasmussen Reports. The margin of sampling error is +/- 3 percentage points with a 95% level of confidence. Field work for all Rasmussen Reports surveys is conducted by Pulse Opinion Research, LLC. See methodology.
November 3, 2013

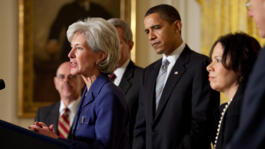
44% View Sebelius Unfavorably

Just over a year ago, most voters didn't know enough about Kathleen Sebelius to have any kind of opinion of her, even though the secretary of Health and Human Services was in the powerful position of implementing the new national health care law. Now that Obamacare's off to a troubled start, a plurality of voters don't care much for her. 

A new Rasmussen Reports national telephone survey finds that 25% of Likely U.S. Voters have a favorable opinion of Sebelius, including nine percent (9%) with a Very Favorable one. But 44% share an unfavorable opinion of the HHS secretary, with 31% who view her Very Unfavorably. One-in-three (32%) still aren't sure.  (To see survey question wording, click here.)

(Want a free daily e-mail update? If it's in the news, it's in our polls). Rasmussen Reports updates are also available on Twitter or Facebook.

The survey of 1,000 Likely Voters was conducted on October 30-31, 2013 by Rasmussen Reports. The margin of sampling error is +/- 3 percentage points with a 95% level of confidence. Field work for all Rasmussen Reports surveys is conducted by Pulse Opinion Research, LLC. See methodology.

October 30, 2013

47% Say It’s Possible For Anyone to Find Work, 42% Disagree

Pessimism about the current job market has risen again this month, but Americans are showing a bit more confidence in the ability to get rich through hard work.

Forty-seven percent (47%) of American Adults now believe it’s possible for anyone in this country looking for work to find a job, according to a new Rasmussen Reports national telephone survey. This marks the first time this figure has fallen below 50% since March. Forty-two percent (42%) say it’s not possible for anyone to find work, tying the highest level of pessimism since September 2011. Eleven percent (11%) are not sure. (To see survey question wording, click here.)

(Want a free daily e-mail update? If it's in the news, it's in our polls). Rasmussen Reports updates are also available on Facebook.

The survey of 1,000 American Adults was conducted on October 25-26, 2013 by Rasmussen Reports. The margin of sampling error is +/- 3 percentage points with a 95% level of confidence. Field work for all Rasmussen Reports surveys is conducted by Pulse Opinion Research, LLC. See methodology.
October 29, 2013

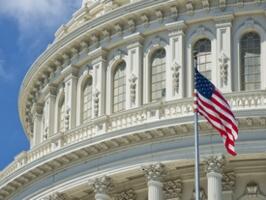
64% View Federal Government Unfavorably

Thirty-three percent (33%) of Likely U.S. Voters have at least a somewhat favorable view of the federal government, but that includes just eight percent (8%) with a Very Favorable one. A new Rasmussen Reports national telephone survey finds that 64% regard the federal government unfavorably, with 34% who have a Very Unfavorable opinion of it. (To see survey question wording, click here.)

The overall findings are unchanged from November of last year, but the number of voters with a Very Unfavorable view of the government has risen six points from 28% at that time.

(Want a free daily e-mail update? If it's in the news, it's in our polls). Rasmussen Reports updates are also available on Facebook.

The survey of 1,000 Likely Voters was conducted on October 24-25, 2013 by Rasmussen Reports. The margin of sampling error is +/- 3 percentage points with a 95% level of confidence. Field work for all Rasmussen Reports surveys is conducted by Pulse Opinion Research, LLC. See methodology.

October 29, 2013

42% Identify with Obama Politically, 42% with the Tea Party

Voters are evenly divided when asked whether they agree more politically with President Obama or with the average member of the Tea Party. But an enormous partisan gap colors virtually all opinions of the Tea Party.

A new Rasmussen Reports national telephone survey finds that 42% of Likely U.S. Voters think the president’s views are closest to their own when it comes to the major issues facing the country. But just as many (42%) say their views come closest to those of the average Tea Party member instead. Sixteen percent (16%) are not sure. (To see survey question wording, click here.)

(Want a free daily e-mail update? If it's in the news, it's in our polls). Rasmussen Reports updates are also available on Facebook.

The survey of 1,000 Likely Voters was conducted on October 26-27, 2013 by Rasmussen Reports. The margin of sampling error is +/- 3 percentage points with a 95% level of confidence. Field work for all Rasmussen Reports surveys is conducted by Pulse Opinion Research, LLC. See methodology.

White letter R on blue background
October 28, 2013

65% Oppose Use of Drones for U.S. Police Work

Voters show even stronger support for increasing the use of unmanned drone aircraft to kill terrorists overseas, even though most believe the drone attacks are killing more innocents than are reported. But voters strongly oppose police use of such drones in the skies over this country.

A new Rasmussen Reports national telephone survey shows that 69% of Likely U.S. Voters favor the use of unmanned drone aircraft to kill al Qaeda and Taliban terrorists overseas. Twenty percent (20%) oppose the use of drones to kill terrorists overseas, while 12% are undecided. (To see survey question wording, click here.)

(Want a free daily e-mail update? If it's in the news, it's in our polls). Rasmussen Reports updates are also available on Twitter or Facebook.

The survey of 1,000 Likely Voters was conducted on October 24-25, 2013 by Rasmussen Reports. The margin of sampling error is +/- 3 percentage points with a 95% level of confidence. Field work for all Rasmussen Reports surveys is conducted by Pulse Opinion Research, LLC. See methodology.

October 25, 2013

44% Favor Gay Marriage, 44% Oppose

Voters nationwide are almost evenly divided when asked if marriage is a religious or civil institution, but slightly more feel laws regarding marriage should be set at the state or local level rather than by the federal government. There are sharp differences of opinion over gay marriage depending on how voters feel about these two issues. 

A new Rasmussen Reports national telephone survey finds that 48% of Likely U.S. Voters consider marriage to be more of a religious institution than a civil one. Nearly as many (45%) regard marriage more as a civil institution. (To see survey question wording, click here.)

(Want a free daily e-mail update? If it's in the news, it's in our polls).  Rasmussen Reports updates are also available on Twitter or Facebook.

The survey of 1,000 Likely Voters was conducted on October 22-23, 2013 by Rasmussen Reports. The margin of sampling error is +/- 3 percentage points with a 95% level of confidence. Field work for all Rasmussen Reports surveys is conducted by Pulse Opinion Research, LLC. See methodology.

economy, budget cuts, budget
October 24, 2013

52% Worry Government Won't Do Enough for Economy; 62% Want Cuts

Following the short-term deal to end the partial government shutdown, voters are more concerned than ever that the federal government will not do enough responding to the weak economy. But most continue to believe spending cuts are the best move the government can make.

A new Rasmussen Reports national telephone survey finds that 52% of Likely U.S. Voters now say they are more worried that the government won’t do enough in reacting to the country's current economic problems, while 37% worry more that it will do too much. Eleven percent (11%) are undecided. (To see survey question wording, click here.)

(Want a free daily e-mail update? If it's in the news, it's in our polls). Rasmussen Reports updates are also available on Twitter or Facebook.

The survey of 1,000 Likely Voters was conducted on October 18-19, 2013 by Rasmussen Reports. The margin of sampling error is +/- 3 percentage points with a 95% level of confidence. Field work for all Rasmussen Reports surveys is conducted by Pulse Opinion Research, LLC. See methodology.

October 22, 2013

32% Still Believe U.S. Society Unfair, Discriminatory

One-third of voters maintain their belief that American society isn't fair -- tying the highest level of pessimism in over six years.

A new Rasmussen Reports national telephone survey finds that just 58% of Likely U.S. Voters now consider American society generally fair and decent.  That is in line with July’s numbers and up only slightly from a recent low of 55% in August of last year.  Thirty-two percent (32%) disagree and think American society is generally unfair and discriminatory. That's unchanged from the previous survey which marked the highest negative view since late July 2007. (To see survey question wording, click here.)

(Want a free daily e-mail update? If it's in the news, it's in our polls). Rasmussen Reports updates are also available on Twitter or Facebook. 

The national telephone survey of 1,000 Likely Voters was conducted by Rasmussen Reports from October 14-15, 2013. The margin of sampling error for the survey is +/- 2 percentage points with a 95% level of confidence. Field work for all Rasmussen Reports surveys is conducted by Pulse Opinion Research, LLC. See methodology.

October 21, 2013

51% Say Government Shutdown Had Some Personal Impact on Them, 46% Say None

In the aftermath of the partial government shutdown that ended last week, voters’ expectations of its personal and economic impact were mostly in line with reality.

Fifty-one percent (51%) of Likely U.S. Voters say the government shutdown had some impact on their personal lives, according to the latest Rasmussen Reports national telephone survey. But that includes 40% who say the shutdown had a minor personal impact and just 11% who say it had a major one. Forty-six percent (46%) say the shutdown did not personally impact them at all. (To see survey question wording, click here.)  


(Want a free daily e-mail update? If it's in the news, it's in our polls). Rasmussen Reports updates are also available on Twitter or Facebook.

The survey of 1,000 Likely Voters was conducted on October 18-19, 2013 by Rasmussen Reports. The margin of sampling error is +/- 3 percentage points with a 95% level of confidence. Field work for all Rasmussen Reports surveys is conducted by Pulse Opinion Research, LLC. See methodology.

October 18, 2013

43% Know Someone Who Joined Military To Get A Job

More Americans know someone who has joined the military because they needed a job, but fewer think veterans are receiving the appropriate benefits for their service.

A new Rasmussen Reports national telephone survey finds that 43% of American Adults now say they know someone who has joined the military because of the bad job market. That's up four points from 39% in January 2012. (To see survey question wording, click here.)

(Want a free daily e-mail update? If it's in the news, it's in our polls). Rasmussen Reports updates are also available on Twitter or Facebook.

The survey of 1,000 Adults was conducted on October 15-16, 2013 by Rasmussen Reports. The margin of sampling error is +/- 3 percentage points with a 95% level of confidence. Field work for all Rasmussen Reports surveys is conducted by Pulse Opinion Research, LLC. See methodology.
Please sign up for the Rasmussen Reports daily e-mail update (it’s free) or follow us on Twitter or Facebook. Let us keep you up to date with the latest public opinion news.

Please sign up for the Rasmussen Reports daily e-mail update (it’s free) or follow us on Twitter or Facebook. Let us keep you up to date with the latest public opinion news.

White letter R on blue background
October 18, 2013

53% Still Don’t Trust Feds to Keep NSA Surveillance Legal

Voters remain skeptical of the National Security Agency’s domestic surveillance programs, but most agree that the continued disclosure of details about these programs is probably bad for national security.

Thirty-four percent (34%) of Likely U.S. Voters favor the NSA’s tracking of the telephone calls and e-mails of millions of Americans as part of the effort to fight terrorism, according to a new Rasmussen Reports national telephone survey. Forty-nine percent (49%) are opposed. Seventeen percent (17%) are not sure. (To see survey question wording, click here.)

(Want a free daily e-mail update? If it's in the news, it's in our polls).  Rasmussen Reports updates are also available on Twitter or Facebook.

The survey of 1,000 Likely Voters was conducted on October 16-17, 2013 by Rasmussen Reports. The margin of sampling error is +/- 3 percentage points with a 95% level of confidence. Field work for all Rasmussen Reports surveys is conducted by Pulse Opinion Research, LLC. See methodology.

October 17, 2013

56% Feel Americans Less Tolerant of Others’ Political Views

Given the anger over the political stalemate of the past few weeks, it’s not surprising that most Americans believe their fellow citizens are less tolerant of others’ political views these days. But what is surprising is that fewer Americans than ever feel this way.

Fifty-six percent (56%) of American Adults still believe their fellow citizens are less tolerant of other people’s political opinions than they were in the past, according to a new Rasmussen Reports national telephone survey. But that’s down 15 points from last October  and the lowest finding in surveying since 2010. Just 17% believe Americans have grown more tolerant of others’ political views, a finding that has changed little over the years. Twenty-three percent (23%) believe the level of tolerance is about the same. (To see survey question wording, click here.)

(Want a free daily e-mail update? If it's in the news, it's in our polls).  Rasmussen Reports updates are also available on Twitter or Facebook.

The national survey of 1,000 Adults was conducted on October 11-12, 2013 by Rasmussen Reports. The margin of sampling error is +/- 3 percentage points with a 95% level of confidence. Field work for all Rasmussen Reports surveys is conducted by Pulse Opinion Research, LLC. See methodology.

 

Additional information from this survey and a full demographic breakdown are available to Platinum Members only.

Please sign up for the Rasmussen Reports daily e-mail update (it’s free) or follow us on Twitter or Facebook. Let us keep you up to date with the latest public opinion news.

October 16, 2013

78% Want To Throw Out Entire Congress and Start Over

If the next congressional election were held today, it would be bad news for the current members of Congress from both major parties.

Just eight percent (8%) of Likely U.S. Voters would vote to keep the entire current Congress. The latest Rasmussen Reports national telephone survey finds that 78% would vote instead to get rid of the entire Congress and start over again. That’s a 10-point jump from the previous high of 68% in May of last year. Fourteen percent (14%) are undecided. (To see survey question wording, click here.) 

Today’s your last chance! Sign up for Rasmussen Reader subscription through December 31, 2014 for just $24.95. Offer expires October 16, 2013.

(Want a free daily e-mail update? If it's in the news, it's in our polls). Rasmussen Reports updates are also available on Twitter or Facebook.

The survey of 1,000 Likely Voters was conducted on October 14-15, 2013 by Rasmussen Reports. The margin of sampling error is +/- 3 percentage points with a 95% level of confidence. Field work for all Rasmussen Reports surveys is conducted by Pulse Opinion Research, LLC. See methodology.

October 16, 2013

30% Consider Significant Spending Cuts Likely Over Next Few Years

As the deadline for raising the federal debt ceiling approaches, most voters still want lawmakers to consider spending cuts in all federal government programs - without exceptions - but don’t expect any significant cuts to be made.

Sixty-three percent (63%) of Likely U.S. Voters believe thoughtful spending cuts should be considered in every program of the federal government, according to a new Rasmussen Reports national telephone survey. Twenty-four percent (24%) disagree, while 13% are undecided. (To see survey question wording, click here.)

Last Day!  Sign up for Rasmussen Reader subscription through December 31, 2014 for just $24.95. Offer expires October 16, 2013.

(Want a free daily e-mail update? If it's in the news, it's in our polls). Rasmussen Reports updates are also available on Twitter or Facebook. 

The national telephone survey of 1000 Likely Voters was conducted by Rasmussen Reports from October 10-11, 2013. The margin of sampling error for the survey is +/- 3 percentage points with a 95% level of confidence. Field work for all Rasmussen Reports surveys is conducted by Pulse Opinion Research, LLC. See methodology.
October 15, 2013

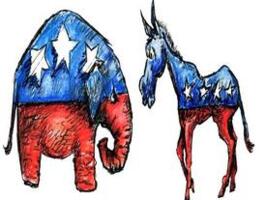
46% Want Democrats to Control Congress, 45% Prefer GOP In Charge

After two weeks of a partial government shutdown, ask voters which party they want in charge of Congress, and - it’s a draw.

Right now, Democrats control the U.S. Senate, and Republicans have the majority in the House of Representatives. Forty-six percent (46%) of Likely U.S. Voters would vote for the Democratic Party to be in charge of the entire Congress if their vote in next year’s elections was the determining factor. A new Rasmussen Reports national telephone survey finds that just as many (45%) would vote for the Republican Party to be totally in control. (To see survey question wording, click here.)

Just One Day Left! Sign up for Rasmussen Reader subscription through December 31, 2014 for just $24.95. Offer expires October 16, 2013.

(Want a free daily e-mail update? If it's in the news, it's in our polls). Rasmussen Reports updates are also available on Twitter or Facebook.

The survey of 1,000 Likely Voters was conducted on October 12-13, 2013 by Rasmussen Reports. The margin of sampling error is +/- 3 percentage points with a 95% level of confidence. Field work for all Rasmussen Reports surveys is conducted by Pulse Opinion Research, LLC. See methodology.

October 14, 2013

47% Think Neither Political Party Represents the American People

Belief that the Republican Party has a plan for the future has tumbled 20 points since last year, but nearly half of voters still believe neither major political party represents the American people.

The latest Rasmussen Reports national telephone survey finds that just 34% of Likely U.S. Voters believe the GOP has a plan for where it wants to take the nation. That’s down from 54% in June 2012  and back to levels seen in earlier surveys. Forty-seven percent (47%) think Republicans do not have a plan for the future, while 19% are not sure. (To see survey question wording, click here.)

Just Two Days Left! Sign up for Rasmussen Reader subscription through December 31, 2014 for just $24.95. Offer expires October 16, 2013.

(Want a free daily e-mail update? If it's in the news, it's in our polls). Rasmussen Reports updates are also available on Twitter or Facebook.

The survey of 1,000 Likely Voters was conducted on October 12-13, 2013 by Rasmussen Reports. The margin of sampling error is +/- 3 percentage points with a 95% level of confidence. Field work for all Rasmussen Reports surveys is conducted by Pulse Opinion Research, LLC. See methodology.

October 10, 2013

53% Want Major Spending Cuts As Part of Debt Ceiling Deal

Most voters agree that if Congress and the president don’t raise the federal debt ceiling it will be bad for the economy but think major cuts in government spending should be part of any deal to raise that ceiling.

The latest Rasmussen Reports national telephone survey finds that just 15% of Likely U.S. Voters think there will be no economic impact if the federal government’s $16.7 trillion debt ceiling is not raised. Sixty-two percent (62%) believe it will be bad for the economy if the government defaults on its debt. Twelve percent (12%) say it will be good for the economy. (To see survey question wording, click here.)

Just Six Days Left! Sign up for Rasmussen Reader subscription through December 31, 2014 for just $24.95 . Offer expires October 16, 2013.

(Want a free daily e-mail update? If it's in the news, it's in our polls). Rasmussen Reports updates are also available on Twitter or Facebook.

The survey of 1,000 Likely Voters was conducted on October 8-9, 2013 by Rasmussen Reports. The margin of sampling error is +/- 3 percentage points with a 95% level of confidence. Field work for all Rasmussen Reports surveys is conducted by Pulse Opinion Research, LLC. See methodology.

October 8, 2013

82% of Democrats Say End Shutdown; 71% of GOP Say Keep It Going

Just over half of voters think the partial government shutdown will have a negative impact on them personally and want Congress to end the shutdown by authorizing spending for the health care law at existing levels. But most Republicans still would rather continue the shutdown until spending for the law is cut.

The latest Rasmussen Reports national telephone survey finds that just 13% of Likely U.S. Voters say the shutdown has had a major impact on their personal lives so far. Another 38% say they have felt a minor impact from the shutdown. Forty-seven percent (47%) say it has had no impact at all on them. (To see survey question wording, click here.)

Special offer: A Rasmussen Reader subscription that lasts through December 31, 2014 is now just $24.95. Sign up today!

(Want a free daily e-mail update? If it's in the news, it's in our polls). Rasmussen Reports updates are also available on Twitter or Facebook.

The survey of 1,000 Likely Voters was conducted on October 6-7, 2013 by Rasmussen Reports. The margin of sampling error is +/- 3 percentage points with a 95% level of confidence. Field work for all Rasmussen Reports surveys is conducted by Pulse Opinion Research, LLC. See methodology.