Congressional Redistricting: Is Creating “Safe” Districts a Dying Art?
A Commentary By Rhodes Cook
When it comes to congressional redistricting, the nation’s most populous state is in a class by itself. About a decade ago, the Democratic state legislature passed what would prove to be one of the most perfect “status quo” congressional district maps imaginable. It was designed to create a large cadre of safe seats for both parties, and it did just that.
California has 53 districts. Only one has changed party hands since 2002. The other 52 districts have consistently been held by one party or the other. The result: What was a 33-20 Democratic advantage in the House delegation following the post-redistricting election of 2002 now stands virtually unchanged at 34-19 Democratic.
|
Our Latest 2012 Senate Ratings |
|
Our Latest 2012 Governor Ratings |
|
|
|
Our Latest 2012 Presidential Discussion |
That degree of “status quo” redistricting, however, may be a thing of the past in California. The state’s voters last fall empowered a nonpartisan commission to take over the congressional redistricting process. And many other states that have sought to create a plethora of safe seats for each party has found in recent years that electoral waves can often trump crafty cartography.
Altogether, 100 House districts in 40 states switched party hands at least once after 2002, a number representing nearly one out of every four congressional seats. New York has been the leader with eight districts switching their party representation at least once.
Because some districts switched back and forth between parties in the course of a decade, the total number of changes was about 150. Yet whether a district in any state changed party hands once, twice or even three times since 2002, it counted just once in terms of the number of districts that switched.
Chart 1. “Incumbent Protection”: Is It Overrated?
It is conventional wisdom these days that congressional district lines in most places are drawn to protect incumbents of both parties. But if that is the case, the cartographers in many states last time out did not do a very good job. More House incumbents were beaten under the current lines than in any other period since the 1970s. And for good measure, more House incumbents were defeated in the 2010 election (54) than in any other general election since 1948. The chart below compares the number of defeated House incumbents by decade. Post-redistricting elections that end with a "2? are not included, since incumbents then can often find themselves pitted against each other. Totals are restricted to the four general elections that follow, when the district lines traditionally undergo little or no change. |
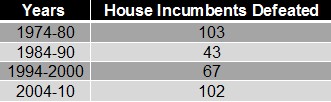
Sources: Based on a chart found in Redistricting: The Most Political Activity in America by Charles S. Bullock III (Rowman & Littlefield), with additional data from Vital Statistics on Congress 2008 by Norman J. Ornstein, Thomas E. Mann and Michael J. Malbin (Brookings Institution Press).
One Switch or Two
Over the course of the decade, House seats shifted from Democrat to Republican, Republican to Democrat, and in the case of Vermont, from Independent Bernie Sanders to a Democrat. The districts were nearly evenly divided between those where there was one switch (52) or two (47), meaning in the latter case that the seat in question returned to the party that originally held it. In one district, the southern Indiana 9th, the movement back and forth was almost biennial. Party representation changed three times after 2002 – from Democrat to Republican in 2004, from Republican to Democrat in 2006 and from Democrat back to Republican in 2010. In the latter two cases, it caught the big political waves that rearranged the political landscape in recent years.
Partisan Terrain
One might guess that most of the shifts from one party to the other occurred in swing districts. But that was not the case. Nearly half (49) took place in “red” districts that had supported Republicans George W. Bush and John McCain in their presidential runs of 2004 and 2008, respectively. Indiana’s 9th District was one of them.
Another 22 switches came in “blue” districts that had voted in recent presidential elections for Democrats John Kerry and Barack Obama. In short, 71 of the 100 districts where partisan changes took place could be considered reasonably safe, or at least clearly leaning to one party or the other.
The remaining 29 districts where changes occurred were “purple,” voting for Bush in 2004 and Obama in 2008. Virginia had two of these swing districts. One was the Tidewater-based 2nd District, which Democrat Glenn Nye won from Republican Thelma Drake in 2008 but lost in 2010. The other was the suburban Northern Virginia 11th, formerly held by Republican Tom Davis. Democrat Gerry Connolly won the district in 2008 and narrowly held it last fall.
The other districts in Virginia that switched parties at least once over the course of the last decade, the south central 5th and the panhandle 9th, were more rural in character and redder in their political hue.
Basic Geography
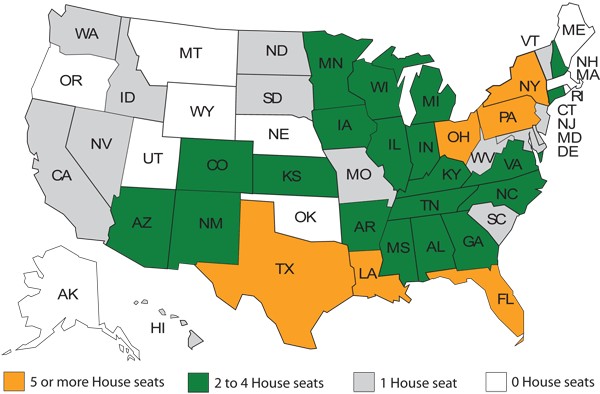
Geographically, the South was the nation’s most volatile region, with 37 districts moving between parties since 2002. Both the Midwest and Northeast had roughly two dozen seats switch party hands, while the West was at the bottom with 13. There, the effectiveness of California’s “status quo” remap overshadowed the changes that were taking place on a bit by bit basis in smaller Western states.
In Arizona and Colorado, three congressional seats switched parties at least once during the last decade. In New Mexico, two did. And across the Sun Belt in Louisiana, five of seven districts had a change in party representation. Switches in the Bayou state came from virtually all the possible ways available: a special election, a change of party affiliation by a sitting member and a trio of seats that moved from one party to the other in general elections.
More Action in Small States
The fluidity of districts in these smaller states has reflected the trend nationally since 2002, with the movement of House seats inversely related to the size of the state. For example, in states with 10 or more House districts, less than 20% of the seats changed party hands. In states with two to nine congressional districts, nearly one third of the districts moved from one party to the other. And in states with single-member districts, a majority of seats changed party representation at least once over the last decade. Put another way, since 2002 Delaware, North Dakota, South Dakota and Vermont have each had as many districts change party hands (one) as California.
Chart 2. Partisan House Shifts Since 2002: More Movement in Smaller States
The most populous states may have the bulk of the U.S. House seats, but they are not where the majority of partisan seat switches have taken place since the last nationwide round of congressional redistricting a decade ago. It is in states with nine or fewer districts where there was the most movement between the parties, with the highest proportion of change in single-member states. The chart below indicates the number of House districts where party representation changed at least once since 2002, as a result of a general or special election, or a party switch by the incumbent. |
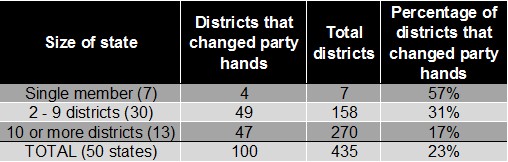
Note: The number in parentheses in the chart above refers to the total number of states in each category.
Source: Compiled by the author using America Votes (CQ Press).
The Road Ahead
The current redistricting process is different from the last one in a variety of ways. Republican gubernatorial and state legislative gains last fall put the GOP in a much stronger position in many states to push through maps of their choosing.
On the other hand, for the first time in more than four decades, the federal Justice Department is in the hands of the Democrats at redistricting time. That puts them in position to review redistricting plans from states required to seek federal approval under the Voting Rights Act, many of which are in the South where Republicans hold sway.
And then there is the voter-approved commission in California empowered to draw more competitive congressional districts, as well as a voter-approved constitutional amendment in Florida that declares that districts “may not be drawn to favor or disfavor an incumbent or political party.”
Yet no matter which mode of redistricting is employed, the handiwork of the cartographers will continue to be challenged over the next decade by changing demographics, the ups and downs of the economy and an ever-evolving political environment. In short, safe congressional seats will always be with us, but probably not as many as their most ambitious creators would want.
Chart 3. State by State: House Districts that Changed Party Hands Since 2002
Altogether, 100 U.S. House districts in 40 states switched party hands at least once since the last nationwide redistricting took place nearly a decade ago. In calculating partisan changes, the election of 2002 is considered the base year, with changes that occurred since then -- in general and special elections or as a result of a party switch by a member -- added together to create the total for each state. Texas underwent a major mid-decade redistricting that decimated the districts of a number of Democratic congressmen. An asterisk (*) indicates that only those partisan seat changes are counted in Texas that occurred after the new district lines had been in effect for at least one election cycle or the district went largely unchanged. Also included in the Texas total is the party switch by Rep. Ralph Hall from Democrat to Republican earlier in the decade |
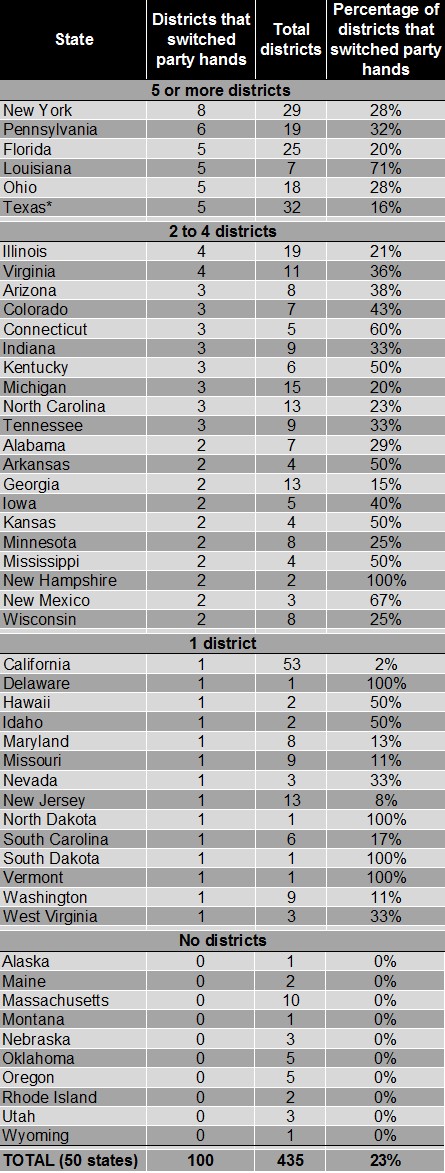
Source: Compiled by the author using America Votes (CQ Press).
Rhodes Cook is a senior columnist at the Center for Politics at the University of Virginia
See Other Commentary by Rhodes Cook.
See Other Political Commentary.
Views expressed in this column are those of the author, not those of Rasmussen Reports.
Rasmussen Reports is a media company specializing in the collection, publication and distribution of public opinion information.
We conduct public opinion polls on a variety of topics to inform our audience on events in the news and other topics of interest. To ensure editorial control and independence, we pay for the polls ourselves and generate revenue through the sale of subscriptions, sponsorships, and advertising. Nightly polling on politics, business and lifestyle topics provides the content to update the Rasmussen Reports web site many times each day. If it's in the news, it's in our polls. Additionally, the data drives a daily update newsletter and various media outlets across the country.
Some information, including the Rasmussen Reports daily Presidential Tracking Poll and commentaries are available for free to the general public. Subscriptions are available for $4.95 a month or 34.95 a year that provide subscribers with exclusive access to more than 20 stories per week on upcoming elections, consumer confidence, and issues that affect us all. For those who are really into the numbers, Platinum Members can review demographic crosstabs and a full history of our data.
To learn more about our methodology, click here.