Incumbent Defeats By The Numbers
A Commentary by Larry J. Sabato
At the Crystal Ball we receive many requests for information about the history of congressional elections, and there are many ways to look at this topic. In the two simple bar graphs below, we present one way to conceptualize a key part of the contests for Congress. How many incumbents lose for the House and the Senate?
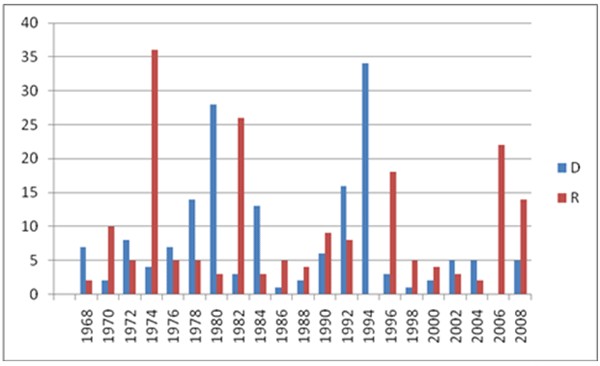
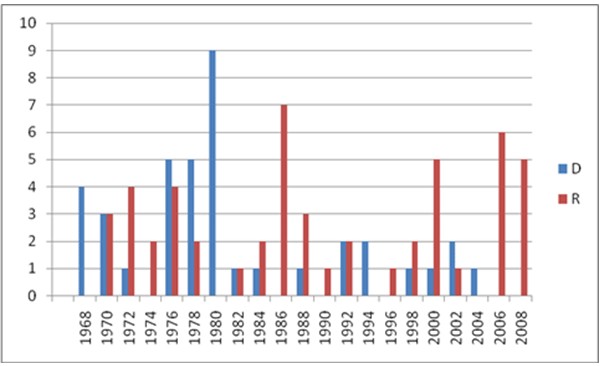
In most years—both presidential and midterm—incumbents do remarkably well, and just a handful lose their seats in the general election. But a few years bring congressional slaughters, relatively speaking: 1974, 1980, 1982, 1994, and 2006 are the most prominent since the late 1960s. One party or the other suffers more in any given year, as the pendulum of public opinion swings back and forth.
Will 2010 be added to the “slaughter years”? The general election is a couple months away, but the odds are good that the bar lines in this graph will reach reasonably high after November 2.
House Incumbent Defeats, 1968-2008
Senate Incumbent Defeats, 1968-2008
Larry J. Sabato is the director of the Center for Politics at the University of Virginia.
See Other Commentary by Larry Sabato
See Other Political Commentary
Related Articles


Rasmussen Reports is a media company specializing in the collection, publication and distribution of public opinion information.
We conduct public opinion polls on a variety of topics to inform our audience on events in the news and other topics of interest. To ensure editorial control and independence, we pay for the polls ourselves and generate revenue through the sale of subscriptions, sponsorships, and advertising. Nightly polling on politics, business and lifestyle topics provides the content to update the Rasmussen Reports web site many times each day. If it's in the news, it's in our polls. Additionally, the data drives a daily update newsletter and various media outlets across the country.
Some information, including the Rasmussen Reports daily Presidential Tracking Poll and commentaries are available for free to the general public. Subscriptions are available for $4.95 a month or 34.95 a year that provide subscribers with exclusive access to more than 20 stories per week on upcoming elections, consumer confidence, and issues that affect us all. For those who are really into the numbers, Platinum Members can review demographic crosstabs and a full history of our data.
To learn more about our methodology, click here.