Will the Republicans Win Back the House in November?
A Commentary By Alfred G. Cuzan
This week the Crystal Ball publishes a prediction that suggests the House majority may stay with the Democrats, written by Professor Alfred G. Cuzan of the University of West Florida. While Professor Cuzan makes a compelling case, the Crystal Ball’s unique dual method—examining all 435 House races individually and incorporating the result of statistical analysis based on past elections and developed over many years by Professor Alan Abramowitz, one of our Senior Columnists at the Crystal Ball—has pointed to a House gain of +47 seats for the GOP, which would deliver the majority into Republican hands. We urge our readers to consider Professor Cuzan’s analysis and arguments, and decide for themselves which outcome they believe is more likely. – Larry J. Sabato, Editor |
For the Republicans to regain control of the House of Representatives this year, they need to wrest away 40 of the 257 seats the Democrats won in 2008. Put differently, the Democratic representation needs to be reduced by almost 16%. To evaluate the likelihood of that eventuality, we begin with the well-known fact that historically the party of the president, the incumbents, almost always incurs a net loss of House seats in midterm elections. As shown in Figure 1, in 14 out of 35 midterm elections held since 1870, or 40 percent of the time, the president’s party shrunk by more than 40 members, which is this year’s party turnover point. In four exceptional cases (1902, 1934, 1998, and 2002), the incumbents actually gained a small number of seats. The first exception occurred scarcely a year after President McKinley’s assassination, when sympathy for the incumbents must have been running high; the second took place in the middle of the anti-Republican wave that began in 1930 and peaked in 1936; the third may have reflected a backlash against the impeachment of President Clinton; and the last one can be attributed to the 9/11/2001 rally.
Figure 1. Midterm Incumbent Net Seat Loss or Gain, 1870-2006
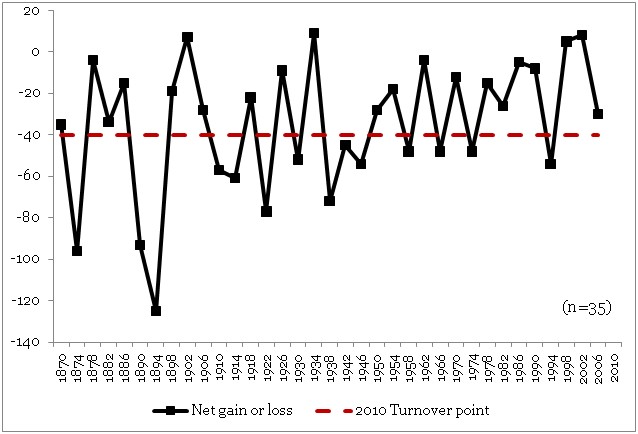
Omitting these exceptions, none of which bears any similarity to this year’s political environment, the odds of the Democrats’ losses breaching what is this year’s party turnover point rise to 14 out of 31 (45 percent). Consider, as well, that the mean incumbent seat loss across all midterm elections is 35 seats, although there is considerable variation around that number. Also, as a proportion of the seats won in the previous election, the average loss is 15%. Thus, a naïve forecast for 2010 would be that the Democrats will lose between 35 and 39 seats (15% of 257). It calls for the Democrats to remain the majority party in the House, with but a handful of seats to spare.
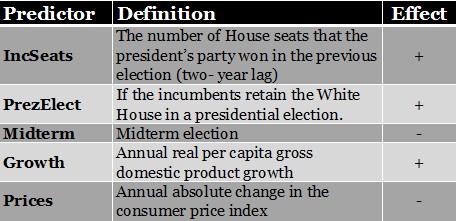
Next, shown in Table 1 is a general model of the number of House seats won by the party of the president, estimated with elections beginning with that of 1870. It consists of five variables. The number of seats won in the previous election (a two-year lag), retaining the White House in a presidential election, and economic growth exert a positive effect on the incumbents’ performance at the polls, while midterm elections and the absolute change in the price level have a negative impact.
Table 1. Modeling Incumbent House Seats, 1870-2008
For the purpose of generating a forecast for 2010 with this model, it was assumed that (1) real per capita GDP grows 2% and (2) inflation is limited to 1%. The point forecasts generated with several versions of the model (one with all 70 presidential and midterm elections, another with the 35 midterm elections only, and one more of each type with several outliers excluded) range from 221 to 226 seats, for a net loss of 31 to 36 seats. According to these models, the probability that the Democrats will win more than 217 seats lies between 0.59 and 0.67. In other words, in the race to win a majority of the seats the Democrats have the edge. However, the chances for a Republican victory are by no means trivial—between one in three and two in five.
Like all forecasts, this one is subject to error. Generally, a model that does not include poll data at either the national or district level will incur a larger error than those that do. In a test of the forecasting accuracy of the model, it was found that over the most recent ten elections (excluding the 1998 and 2002 midterms) the average error was about 6% of the prediction. Since, as of mid-September, the generic congressional ballot is showing the Republicans with a healthy lead, the error incurred this year is most likely to be one of overshooting rather than undershooting the actual number of seats the Democrats will end up with on Election Day. If that is the case, assuming that this year’s forecast is overshooting the mark by the aforementioned 6% would mean that the actual Democratic net loss would fall somewhere in the 43 to 48 seats range, enough for a Republican takeover.
Alfred G. Cuzan is Professor of Political Science at The University of West Florida. He has been a National Endowment for the Humanities Fellow, a Liberty Fund fellow, and a Henry Salvatori Fellow of the Heritage Foundation. Most of his most recent publications have been on American presidential elections. This article is adapted from a paper presented at the Florida Political Science Association last month.
For other Commentary from Sabato's Crystal Ball at the University of Virginia see:
Commentary By Larry J. Sabato or Commentary by Isaac J. Wood
Other Commentary by Alfred G. Cuzan
Rasmussen Reports is a media company specializing in the collection, publication and distribution of public opinion information.
We conduct public opinion polls on a variety of topics to inform our audience on events in the news and other topics of interest. To ensure editorial control and independence, we pay for the polls ourselves and generate revenue through the sale of subscriptions, sponsorships, and advertising. Nightly polling on politics, business and lifestyle topics provides the content to update the Rasmussen Reports web site many times each day. If it's in the news, it's in our polls. Additionally, the data drives a daily update newsletter and various media outlets across the country.
Some information, including the Rasmussen Reports daily Presidential Tracking Poll and commentaries are available for free to the general public. Subscriptions are available for $4.95 a month or 34.95 a year that provide subscribers with exclusive access to more than 20 stories per week on upcoming elections, consumer confidence, and issues that affect us all. For those who are really into the numbers, Platinum Members can review demographic crosstabs and a full history of our data.
To learn more about our methodology, click here.