Democrats Maintain Lead on Generic Ballot
Democrats continue to lead over Republicans on the latest Rasmussen Reports Generic Congressional Ballot.
Democrats continue to lead over Republicans on the latest Rasmussen Reports Generic Congressional Ballot.
Democrats have once again widened their lead over Republicans on the latest Rasmussen Reports Generic Congressional Ballot.
Democrats have narrowed their lead over Republicans again on the latest Rasmussen Reports Generic Congressional Ballot.
Democrats have lengthened their lead on the latest Rasmussen Reports Generic Congressional Ballot.
Democrats continue to hold onto their lead on this week’s Rasmussen Reports Generic Congressional Ballot.
Democrats maintain a slight lead on this week’s Rasmussen Reports Generic Congressional Ballot.
Democrats maintain a slight lead on this week’s Rasmussen Reports Generic Congressional Ballot.
Democrats maintain a slight lead on this week’s Rasmussen Reports Generic Congressional Ballot.
Democrats have regained a slight lead on this week’s Rasmussen Reports Generic Congressional Ballot.
Republicans and Democrats are running neck-and-neck on the Rasmussen Reports Generic Congressional Ballot again this week.

Republicans have closed the gap in the Rasmussen Reports Generic Congressional Ballot.

Democrats still have the advantage in this week’s Rasmussen Reports Generic Congressional Ballot.
Democrats continue to hold a slight lead over Republicans on the Generic Congressional Ballot, though that lead has narrowed since the beginning of the year.
Voters started the year favoring the Democrats, and while the party still leads, more voters are pulling for the Republicans as midterm elections get closer.
With midterms on the horizon, voters now seem to want a shift in Congressional leadership.
Republicans and Democrats are now tied on the latest Generic Congressional Ballot.
A new Rasmussen Reports national telephone survey for the week ending May 7 finds that 38% of Likely U.S. Voters would vote for the Republican candidate in their district's congressional race if the election were held today, while another 38% would choose the Democrat instead. Twenty-four percent (24%) prefer a third-party candidate or are undecided.
Republicans hold a two-point lead on the latest Generic Congressional Ballot.
A new Rasmussen Reports national telephone survey for the week ending April 30 finds that 40% of Likely U.S. Voters would vote for the Republican candidate in their district's congressional race if the election were held today, while 38% would choose the Democrat instead. Twenty-three percent (23%) prefer a third-party candidate or are undecided.
Republicans have a one-point lead on the latest Generic Congressional Ballot.
A new Rasmussen Reports national telephone survey for the week ending April 23 finds that 39% of Likely U.S. Voters would vote for the Republican candidate in their district's congressional race if the election were held today, while 38% would choose the Democrat instead. Twenty-two percent (22%) prefer a third-party candidate or are undecided.
(Want a free daily e-mail update? If it's in the news, it's in our polls). Rasmussen Reports updates are also available on Twitter or Facebook.
The national telephone survey of 2,500 Likely Voters was conducted by Rasmussen Reports from April 19-23, 2015. The margin of sampling error for the survey is +/- 2 percentage points with a 95% level of confidence. Field work for all Rasmussen Reports surveys is conducted by Pulse Opinion Research, LLC. See methodology.
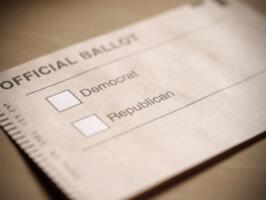
Republicans and Democrats are tied on the latest Generic Congressional Ballot.
A new Rasmussen Reports national telephone survey for the week ending April 16 finds that 39% of Likely U.S. Voters would vote for the Republican candidate in their district's congressional race if the election were held today, while another 39% would choose the Democrat instead. Twenty-three percent (23%) prefer a third-party candidate or are undecided.
(Want a free daily e-mail update? If it's in the news, it's in our polls). Rasmussen Reports updates are also available on Twitter or Facebook.
The national telephone survey of 2,500 Likely Voters was conducted by Rasmussen Reports from April 12-16, 2015. The margin of sampling error for the survey is +/- 2 percentage points with a 95% level of confidence. Field work for all Rasmussen Reports surveys is conducted by Pulse Opinion Research, LLC. See methodology.
Demographic details and trends for this survey are available for Platinum Members only.
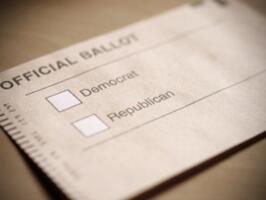
Republicans are still ahead on the Generic Congressional Ballot.
A new Rasmussen Reports national telephone survey for the week ending April 9 finds that 40% of Likely U.S. Voters would vote for the Republican candidate in their district's congressional race if the election were held today, while 37% would choose the Democrat instead. Twenty-three percent (23%) prefer a third-party candidate or are undecided.
[Have we heard from you yet? The 2015 Rasmussen Reports reader survey is the most important poll we’ll take all year. Take the survey now--there are only a few days left!]
(Want a free daily e-mail update? If it's in the news, it's in our polls). Rasmussen Reports updates are also available on Twitter or Facebook.
The national telephone survey of 2,500 Likely Voters was conducted by Rasmussen Reports from April 5-9, 2015. The margin of sampling error for the survey is +/- 2 percentage points with a 95% level of confidence. Field work for all Rasmussen Reports surveys is conducted by Pulse Opinion Research, LLC. See methodology.
