Excluding Undocumented Immigrants from the 2020 U.S. House Apportionment
A Commentary By Dudley L. Poston Jr. and Teresa A. Sullivan
Which states would lose seats and which states would gain seats?
KEY POINTS FROM THIS ARTICLE
— President Trump recently indicated that he wants the 2020 census reapportionment of House seats to exclude undocumented immigrants from the calculation.
— If undocumented immigrants are excluded, the 2020 reapportionment calculation will change, including changing the number of House seats allocated to the two largest states, California and Texas.
— There are significant legal and logistical hurdles that probably will prevent undocumented immigrants from being excluded from congressional reapportionment calculations.
Introduction
On July 21, 2020, President Donald Trump addressed a memorandum to the U.S. Department of Commerce directing the Census Bureau to report to him, in addition to the 2020 Census population counts by state, the estimated numbers of undocumented immigrants by state. These data would be included in his report to the Congress on apportioning the U.S. House of Representatives for the 2022 elections. The New York Times reported that Trump’s “action directly conflicts with the traditional consensus interpretation of the Constitution and will almost surely be challenged in court, potentially delaying its effect if not blocking its enactment altogether.” Nevertheless, we explore here the implications of the president’s directive with respect to the 2020 apportionment of the U.S. House if undocumented immigrants are excluded. Which states would gain seats and which states would lose seats?
Apportioning the House in 2010
The main objective in apportioning the U.S. House is to assign equitably the 435 seats to the 50 states; the District of Columbia is not included in the apportionment. The first 50 seats are automatically assigned, one per state. The method of Equal Proportions is then used to divide up the remaining 385 seats among the states on the basis of the size of their populations. The method determines which states should receive second seats, which states should receive third seats, and so forth. The larger the population of a state, the more seats it receives. The method of Equal Proportions was first used to apportion the House in 1940 and has been used ever since.
The apportionment population of a state is defined as all persons residing in the state as of April 1, plus all American military and civilian personnel of the federal government and their dependents from the state who were residing abroad; this latter group is known as the overseas population.
Table 1: 2020 reapportionment projections
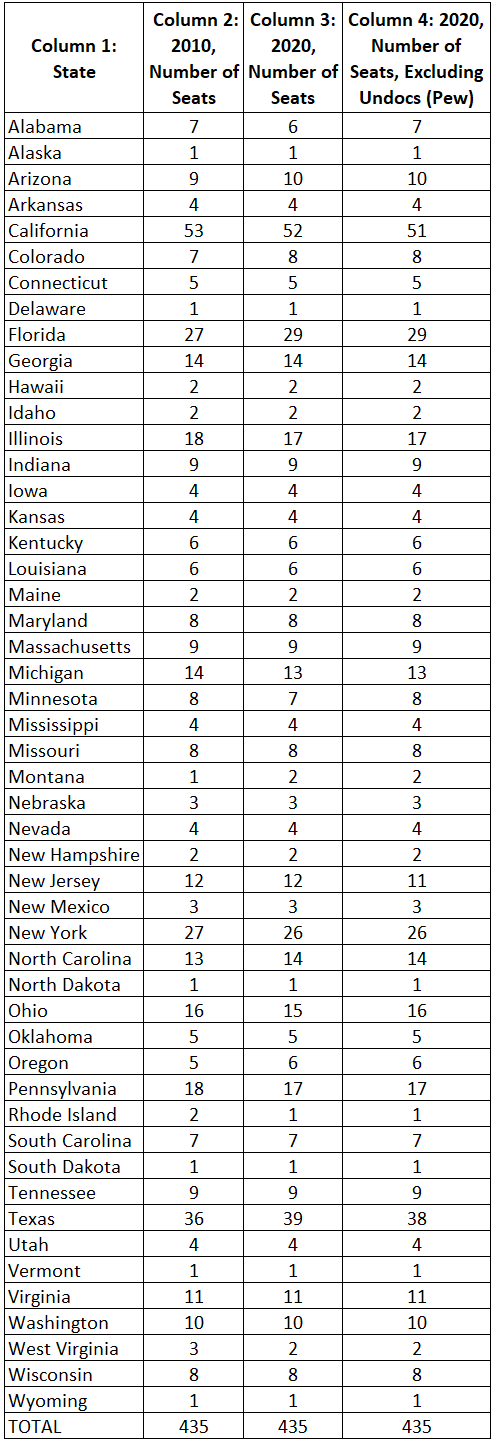
The results of the apportionment based on the 2010 Census are shown in Table 1, column 2; the names of the states are listed in column 1. In 2010, the state receiving the largest number of seats was California with 53; Texas followed with 36 seats, and then Florida and New York with 27 apiece. The states of Alaska, Delaware, Montana, North Dakota, South Dakota, Vermont, and Wyoming each received only one seat, the one they are granted automatically.
Apportioning the House after the 2020 census
For this exercise, we have projected to 2020 the apportionment populations of the 50 states and then used the method of Equal Proportions to distribute among the states the remaining 385 House seats. Remember that every one of the 50 states first automatically receives a seat. We began with the estimated resident populations of the states for July 1, 2019 as produced by the U.S. Census Bureau; we then subtracted from these 2019 estimates their July 1, 2018 estimated counts. We then took three-fourths of the differences, and added them to the 2019 population estimates, to yield the projected April 1, 2020 counts of the resident populations of the states. To determine the overseas populations of the states, we calculated the proportion of each state’s 2010 overseas population to its 2010 resident population. We multiplied these 2010 overseas proportions by the 2020 resident population projections of the states to produce overseas estimates for 2020; we added them to the 2020 resident populations to produce projections of the 2020 apportionment populations.
We then allocated the House seats to the states. We first gave each state its automatic first seat. We then used the method of Equal Proportions to assign the remaining 385 seats. The 2020 seat assignments are presented in column 3 of Table 1.
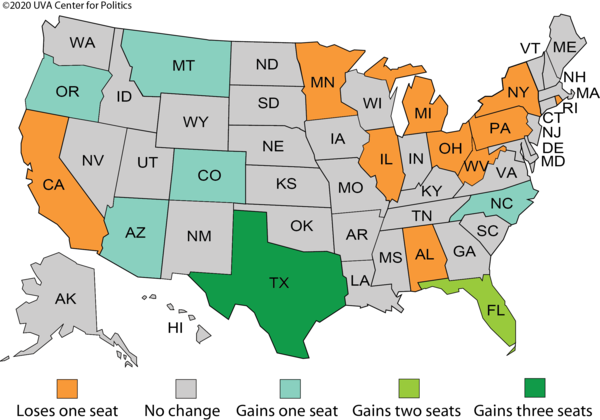
We show that 10 states are projected to lose House seats in 2020: Alabama -1 (from 7 to 6), California -1 (from 53 to 52), Illinois -1 (from 18 to 17), Michigan -1 (from 14 to 13), Minnesota -1 (from 8 to 7), New York -1 (from 27 to 26), Ohio -1 (from 16 to 15), Pennsylvania -1 (from 18 to 17), Rhode Island -1 (from 2 to 1), and West Virginia -1 (from 3 to 2).
As those states are poised to lose seats, seven states are projected to gain House seats in 2020. These are Texas +3 (from 36 to 39), Florida +2 (from 27 to 29), Arizona +1 (from 9 to 10), Colorado +1 (from 7 to 8), Montana +1 (from 1 to 2), North Carolina +1 (from 13 to 14), and Oregon +1 (from 5 to 6).
These projections are illustrated in Map 1.
Map 1: 2020 reapportionment projection
These results are almost the same as the projected 2020 seat assignments produced last year by Election Data Services.
Apportioning the House after 2020 excluding undocumented residents
To gain an understanding of the possible effects of President Trump’s directive to exclude undocumented persons from the apportionment populations, we next developed for the 50 states population projections and U.S. House seat assignments for 2020 excluding their undocumented residents. We first obtained estimated numbers of undocumented immigrants residing in the states in 2017 produced last year by demographers Jeffrey S. Passel and D’Vera Cohn of the Pew Research Center. They used a residual method to estimate the number of undocumented immigrants residing in the 50 states in 2017, totaling approximately 10.5 million persons. We divided these 2017 undocumented estimates of the states by the 2017 Census Bureau estimates of their resident populations to obtain estimates of the proportion of undocumented immigrants in the states in 2017. We multiplied these proportions by the states’ projected 2020 resident populations and subtracted them from the 2020 resident populations. Finally, we added in our estimates of the states’ overseas populations, as discussed above, to produce 2020 apportionment counts for the states that exclude undocumented immigrants. We are assuming that the estimated proportions of undocumented immigrants in the states in 2017 are correct and will be the same proportions in 2020.
We then used the method of Equal Proportions to apportion the House using these apportionment counts that exclude undocumented immigrants. The seat assignments are presented in column 4 of Table 1. How do these seat assignments based on 2020 counts excluding our estimated numbers of undocumented immigrants compare with 2020 seat assignments that do not exclude undocumented immigrants? Compare column 3 with column 4. Three states gain a seat in 2020 compared to the number of seats they are projected to receive in 2020 if undocumented persons are not excluded, and three states lose a seat: Alabama +1 (from 6 to 7), Minnesota +1 (from 7 to 8), and Ohio +1 (from 15 to 16); and California -1 (from 52 to 51), New Jersey -1 (from 12 to 11), and Texas -1 (from 39 to 38).
Steven A. Camarota and Karen Zeigler of the Center for Immigration Studies published research late last year in which they also apportioned the House after excluding undocumented residents. Their results are the same as our results, except that they show New York, and not New Jersey, losing a seat.
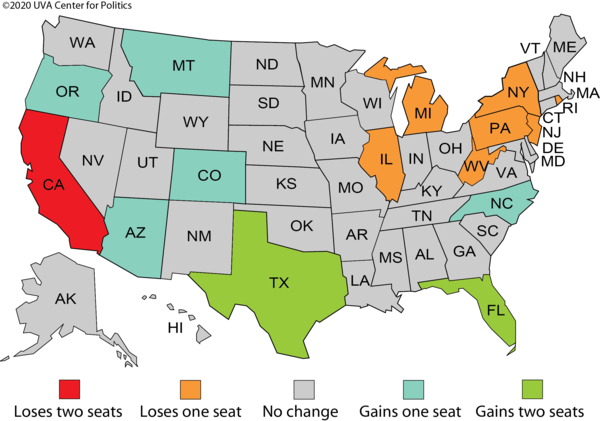
Finally, if the 2020 apportionment excludes undocumented immigrants, what will be the changes in seat assignments between 2010 and 2020? Compare column 2 with column 4. If undocumented persons are excluded in 2020, we predict that eight states will lose nine seats, namely, California -2 (from 53 to 51), Illinois -1 (from 18 to 17), Michigan -1 (from 14 to 13), New Jersey -1 (from 12 to 11), New York -1 (from 27 to 26), Pennsylvania -1 (from 18 to 17), Rhode Island -1 (from 2 to 1), and West Virginia -1 (from 3 to 2); and we predict that seven states will gain nine seats in 2020, namely, Texas +2 (from 36 to 38), Florida +2 (from 27 to 29), Arizona +1 (from 9 to 10), Colorado +1 (from 7 to 8), Montana +1 (from 1 to 2), North Carolina +1 (from 13 to 14), and Oregon +1 (from 5 to 6).
Map 2: 2020 reapportionment projection excluding undocumented immigrants
Technical and legal obstacles
Our estimates of the numbers of undocumented residents for the states would not be sufficient for use in the official apportionment. Moreover, it is not clear whether the Secretary of Commerce could produce acceptable numbers of undocumented residents according to the timetable the new memorandum requires. Last year, President Trump’s Executive Order 13880 instructed the Bureau to develop its “best citizenship” assessment for each enumerated person by linking that person with administrative records held by government agencies. Those data, however, were to be made available to the states for redistricting (not for apportionment) and are not due until March 31, 2021. Also, the Supreme Court has struck down the use of sampling data for the purpose of congressional apportionment, and a direct count is impossible because of the well-publicized absence of the citizenship question. Whether there is enough time by Jan. 1, 2021 to compare every census return with administrative data seems doubtful.
Even if that gargantuan task could be accomplished, there are formidable obstacles both statutory and constitutional with respect to the exclusion of people who are “best guessed” not to be legally residing in the United States, according to Martin Lederman of the Georgetown University Law Center. Among these issues is that the only constitutionally established exclusion is for “Indians not taxed.” Also, the Constitution requires that apportionment be based on the actual number of inhabitants. Moreover, the president’s recent innovation in apportionment runs counter to the governing statute (2 U.S.C. §2a), which requires him to report “the whole number of persons in each state” and “the number of Representatives to which each state would be entitled . . . by the method known as the method of equal proportions.”
Dudley L. Poston Jr. is an emeritus professor of sociology at Texas A&M University. He was a sociology and demography professor for almost 50 years. His most recent book is the second edition of the Handbook of Population (2019); in 2017, he co-authored with Leon F. Bouvier Population and Society: An Introduction to Demography. Teresa A. Sullivan is president emerita and university professor of sociology at the University of Virginia. Her most recent book is Census 2020: Understanding the Issues (2020).
See Other Political Commentary.
This article is reprinted from Sabato's Crystal Ball.
Views expressed in this column are those of the author, not those of Rasmussen Reports. Comments about this content should be directed to the author or syndicate.
Related Articles

Rasmussen Reports is a media company specializing in the collection, publication and distribution of public opinion information.
We conduct public opinion polls on a variety of topics to inform our audience on events in the news and other topics of interest. To ensure editorial control and independence, we pay for the polls ourselves and generate revenue through the sale of subscriptions, sponsorships, and advertising. Nightly polling on politics, business and lifestyle topics provides the content to update the Rasmussen Reports web site many times each day. If it's in the news, it's in our polls. Additionally, the data drives a daily update newsletter and various media outlets across the country.
Some information, including the Rasmussen Reports daily Presidential Tracking Poll and commentaries are available for free to the general public. Subscriptions are available for $4.95 a month or 34.95 a year that provide subscribers with exclusive access to more than 20 stories per week on upcoming elections, consumer confidence, and issues that affect us all. For those who are really into the numbers, Platinum Members can review demographic crosstabs and a full history of our data.
To learn more about our methodology, click here.