Red State, Blue State: Better or Worse?
Voters living in so-called blue states are more likely than those in red states to have had their taxes raised in recent years and less likely to see an improved economic picture where they live.
A new Rasmussen Reports national telephone and online survey finds that 44% of Likely U.S. Voters believe they live in a blue state politically, while 32% say they live in a red state. One-in-four voters (25%) are not sure. (To see survey question wording, click here.)
Fifty-four percent (54%) say their state has raised taxes in the last five years. But only 25% say their state is in better financial shape than it was five years ago. Thirty-six percent (36%) say it’s in worse shape, while 32% rate their state’s financial condition as about the same.
A closer look finds that 59% of voters who say they live in a blue state have had their taxes raised in recent years, compared to 51% of those who reside in red states.
Thirty-four percent (34%) of red state residents say their state is in better financial shape than it was five years ago, a view shared by only 22% of those who live in blue states. Roughly 40% of voters in both rate their states as in worse shape financially. Twenty-five percent (25%) of those in red states and 35% of those living in blue ones say the financial picture is about the same.
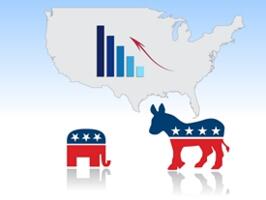
Red states are Republican-leaning; blue states lean Democrat. But Rasmussen Reports did not specify political party affiliations in its questions.
(Want a free daily e-mail update? If it's in the news, it's in our polls). Rasmussen Reports updates are also available on Twitter or Facebook.
The survey of 1,000 Likely Voters was conducted on December 27-28, 2017 by Rasmussen Reports. The margin of sampling error is +/- 3 percentage points with a 95% level of confidence. Field work for all Rasmussen Reports surveys is conducted by Pulse Opinion Research, LLC. See methodology.
In a May 2015 survey, voters in states run mostly by Democrats were more likely than those in GOP-run states to feel their state government was too big.
Nearly half (48%) of Democrats say they live in a blue state. Among Republicans, 39% say they live in a red state, 40% in a blue one. Voters not affiliated with either major party are more likely to live in a blue state, but 34% of these voters are not sure.
A plurality (47%) of voters who live in states that have raised taxes in the last five years says their state is now worse off financially. Just 21% of those in tax-raising states say they are better off.
In states where taxes have not been raised in the last five years, those numbers are reversed: 46% say the state is in better financial shape now versus 23% who say it’s in worse shape.
Voters who Strongly Approve of the job President Trump is doing are twice as likely as those who Strongly Disapprove to say their state is in better financial shape now than it was five years ago.
The majority of all voters have long favored a smaller government with fewer services and lower taxes over a larger, more active one with more services and higher taxes.
Sixty-three percent (63%) think their state government is corrupt, but that compares to 85% who feel that way about the federal government.
In October 2010 as the country fought back against the Wall Street crash and the bursting of the housing bubble, 78% of Americans said their state was having major budget problems, and just as many said tax increases were likely.
California has declared itself a sanctuary state which shields illegal immigrants from federal immigration authorities. But most voters don’t think states have the right to ignore federal laws they don't agree with.
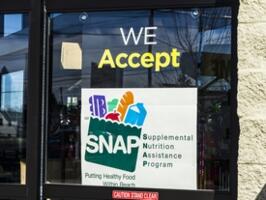
Wisconsin is moving forward with a plan to drug test some food stamp recipients, and most voters nationwide would like to see a similar plan in the state they live in.
Additional information from this survey and a full demographic breakdown are available to Platinum Members only.
Please sign up for the Rasmussen Reports daily email update (it’s free) or follow us on Twitter or Facebook. Let us keep you up to date with the latest public opinion news.
The survey of 1,000 Likely Voters was conducted on December 27-28, 2017 by Rasmussen Reports. The margin of sampling error is +/- 3 percentage points with a 95% level of confidence. Field work for all Rasmussen Reports surveys is conducted by Pulse Opinion Research, LLC. See methodology.
Related Articles

Rasmussen Reports is a media company specializing in the collection, publication and distribution of public opinion information.
We conduct public opinion polls on a variety of topics to inform our audience on events in the news and other topics of interest. To ensure editorial control and independence, we pay for the polls ourselves and generate revenue through the sale of subscriptions, sponsorships, and advertising. Nightly polling on politics, business and lifestyle topics provides the content to update the Rasmussen Reports web site many times each day. If it's in the news, it's in our polls. Additionally, the data drives a daily update newsletter and various media outlets across the country.
Some information, including the Rasmussen Reports daily Presidential Tracking Poll and commentaries are available for free to the general public. Subscriptions are available for $4.95 a month or 34.95 a year that provide subscribers with exclusive access to more than 20 stories per week on upcoming elections, consumer confidence, and issues that affect us all. For those who are really into the numbers, Platinum Members can review demographic crosstabs and a full history of our data.
To learn more about our methodology, click here.