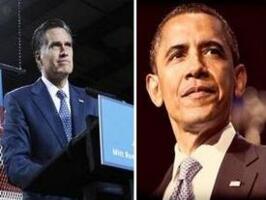
53% See Election As Referendum on Obama’s Agenda
Most voters view this year’s election as a referendum on the Obama presidency rather than one on his Republican challenger’s plans for the future. But independent voters don’t believe that as strongly as GOP voters and Democrats do.
The latest Rasmussen Reports national telephone survey finds that 53% of Likely U.S. Voters consider this election as a referendum on President Obama’s agenda. Only 25% regard it as more about Mitt Romney’s agenda, but nearly as many voters (21%) are undecided. (To see survey question wording, click here.)
Obama won the 2008 election over John McCain by a 53% to 46% margin.
While 54% of Republicans and 59% of Democrats think the coming election is about Obama’s agenda, just 44% of voters not affiliated with either of the major parties agree. But that’s not because more unaffiliated voters think Romney’s agenda is the focus but because nearly one-in-three of these voters (30%) is undecided at this stage of the campaign which is more important.
The White House is the prize in this year’s election as far as a plurality of all voters are concerned. Forty-nine percent (49%) would rather have their party control the White House, while 34% put more weight on control of Congress. Sixteen percent (16%) are not sure.
Fifty-three percent (53%) of both Republicans and Democrats agree that they would rather be in charge of the White House. Unaffiliated voters are evenly divided.
Voters of all persuasions are almost evenly divided when asked which party they would choose if their vote determined who wins control of the House and Senate: 48% say the Democratic Party, while 45% say the Republican Party. Unaffiliated voters prefer the Democrats by five points in both cases.
Win an IPad: Take the Rasmussen Challenge. This week's entries will be accepted until 11:59pm ET tonight.
(Want a free daily e-mail update? If it's in the news, it's in our polls). Rasmussen Reports updates are also available on Twitter or Facebook.
The national survey of 1,000 Likely Voters was conducted on October 1-2, 2012 by Rasmussen Reports. The margin of sampling error is +/- 3 percentage points with a 95% level of confidence. Fieldwork for all Rasmussen Reports surveys is conducted by Pulse Opinion Research, LLC . See methodology.
Ninety percent (90%) of all voters think in terms of its impact on their own lives that it is important if the Republicans or Democrats control Congress after next month’s election. That includes 68% for whom it is Very Important. Just six percent (6%) believe it’s Not Very or Not At All Important which party is in charge on Capitol Hill.
That’s considerably more importance than voters attached to the election in December of last year. At that time, 77% said it was important which party controlled Congress, but that included just 49% who considered it Very Important.
Again, independent voters aren’t as committed to the two parties as their own members are. While 77% of Republicans and 75% of Democrats rate it Very Important when it comes to which party controls Congress, just 43% of unaffiliated voters share that view.
Voters who are members of the Tea Party or members of a labor union are more likely to consider the election a referendum on Romney’s agenda than non-members are.
Seventy-seven percent (77%) of the Political Class would vote for the Democratic Party to ensure their control of both the House and Senate. Just over half of Mainstream voters would vote for the Republican Party if their vote determined which party was in charge of Congress.
But then Political Class voters would rather have their party in charge of Congress over the White House by a 50% to 45% margin. Mainstream voters would opt for control of the White House instead 45% to 36%.
Voters continue to rate the economy as the number one issue in this year’s election, with health care in second. Voters are now looking slightly more favorably on the president’s bailouts of the financial industry and the auto industry than they did for the past three years.
Still voters trust Romney more than Obama by seven points when it comes to handling the economy. On other issues, the candidates are more narrowly divided.
Most voters also still favor repeal of the president’s national health care law.
Additional information from this survey and a full demographic breakdown are available to Platinum Members only.
Please sign up for the Rasmussen Reports daily e-mail update (it’s free) or follow us on Twitter or Facebook. Let us keep you up to date with the latest public opinion news.
The national survey of 1,000 Likely Voters was conducted on October 1-2, 2012 by Rasmussen Reports. The margin of sampling error is +/- 3 percentage points with a 95% level of confidence. Fieldwork for all Rasmussen Reports surveys is conducted by Pulse Opinion Research, LLC . See methodology.
Related Articles
If it's in the News, it's in our Polls. Public opinion polling since 2003.
 2012 Electoral College Scoreboard


Rasmussen Reports is a media company specializing in the collection, publication and distribution of public opinion information.
We conduct public opinion polls on a variety of topics to inform our audience on events in the news and other topics of interest. To ensure editorial control and independence, we pay for the polls ourselves and generate revenue through the sale of subscriptions, sponsorships, and advertising. Nightly polling on politics, business and lifestyle topics provides the content to update the Rasmussen Reports web site many times each day. If it's in the news, it's in our polls. Additionally, the data drives a daily update newsletter and various media outlets across the country.
Some information, including the Rasmussen Reports daily Presidential Tracking Poll and commentaries are available for free to the general public. Subscriptions are available for $4.95 a month or 34.95 a year that provide subscribers with exclusive access to more than 20 stories per week on upcoming elections, consumer confidence, and issues that affect us all. For those who are really into the numbers, Platinum Members can review demographic crosstabs and a full history of our data.
To learn more about our methodology, click here.