Congressional Democrats: From Minority to Majority...and Back Again?
A Commentary By Rhodes Cook
When the Democrats lost control of Congress in 1994, few political pundits saw it coming. But such a prospect in 2010, particularly a GOP takeover of the House of Representatives, is already being discussed as a real prospect.
In 1994, Republicans gained more than 50 seats to win control of the House. Currently, their "magic number" stands at 41, which is the difference between their present total of 177 and the required majority of 218.
An obvious target for the GOP in fashioning a comeback would be seats that they recently held--namely, those lost in the Democratic surges of 2006 and 2008. In the last two election cycles, Democrats scored a net gain of 55 House seats--consolidating their grip in the Northeast, while expanding their beachheads in the nation's heartland. Most of their gains were made in three distinct parts of the country--the Republican-leaning South, the increasingly competitive Mountain West, and the battleground states of the industrial Midwest.
As a result, these newly minted Democratic seats are in large part in competitive, even difficult, terrain. Roughly three-fourths of the districts (42) voted Republican for president in at least one of the last two elections. Twenty-one districts voted for the GOP presidential candidate in both 2004 and 2008.
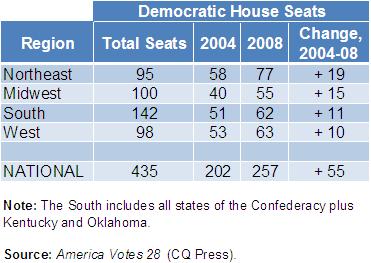
From Minority to Majority: Democratic Gain in House Seats by Region since 2004
During President George W. Bush's second term, Democrats registered a net gain of 55 House seats and vaulted into majority status in Congress' lower chamber. Although Democrats won more new seats in the party's current cornerstone, the Northeast, than any other region, more than half of their House pick-ups in 2006 and 2008 were in the South, Midwest and Mountain West--traditionally less favorable terrain for the party than the Northeast and Pacific West.
Democrats gained these seats in years where they could run with the wind at their back. The question now is: can they hold them in a year where it appears that the breezes will be blowing the opposite direction? That is the $64,000 question. Can the Democrats escape 2010 with their House majority largely intact or will they find themselves with no majority at all?
Virginia offers a trio of case studies. Democrats Gerry Connolly of suburban Northern Virginia and Glenn Nye of the Tidewater were elected in 2008 in "purple districts"--which voted for Republican George W. Bush in 2004 but switched to Democrat Barack Obama four years later.
Meanwhile, Democrat Tom Perriello was an upset winner last year in a "red district" in the interior of the Commonwealth that voted Republican in the last two presidential elections. In what was a favorable Democratic year, Connolly won by 12 percentage points, Nye by 5, and Perriello by just two-tenths of a percentage point.
Virginia in particular and the South in general could readily be the starting point for any Republican comeback in 2010. It is the one region of the country where the party still holds a majority of House seats, and is a place where the GOP has already begun repossessing lost terrain.
In 2008, Republicans won back two districts that they had lost in 2006--the Florida seat held by ethically tainted Mark Foley and the Texas seat of the footloose former House Majority Leader Tom DeLay. In addition, Louisiana Republicans last fall regained the Baton Rouge-based district that they had lost in a spring special election and captured the New Orleans-based seat long held by Democrat William Jefferson, he of the $90,000 in cold, hard cash.
But there are also signs that some of the new Democrats are sinking roots that may be deep enough to withstand a vigorous Republican counterattack. Take former college and pro quarterback Heath Shuler. In his "red" district in western North Carolina, Democrat Shuler increased his vote share from 54 percent in 2006 to 62 percent last year.
To the north in the "purple" Illinois district long held by former Republican House Speaker Dennis Hastert, Democrat Bill Foster increased his 52.5 percent share in a March 2008 special election to 58 percent in November. And across the border in northern Indiana, Democrat Joe Donnelly, who drew 54 percent of the vote in ousting a GOP incumbent in 2006, saw his vote share in his "purple" district spike to 67 percent last November.
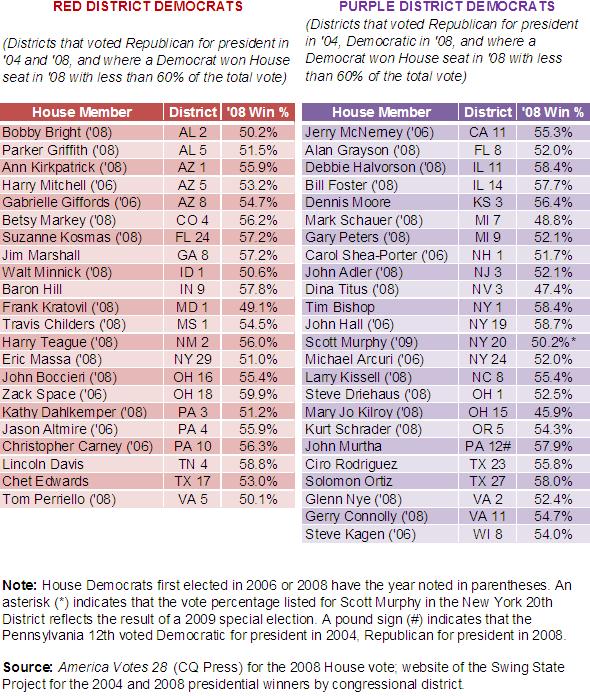
Exposed Democrats: "Low-hanging Fruit" in 2010?
|
When Democrats lost control of both the House and the Senate in 1994, the party's share of the nationwide congressional vote dropped by 5.4 percentage points from 1992. If there is a similar falloff next year from 2008, many of the 46 House Democrats listed below could find themselves in deep trouble. All were sub-60 percent winners in 2008, and represent problematic political terrain. In addition, many were first elected in 2006 or 2008 - both favorable Democratic years--and have yet to run when the wind was not at their back. |
What ultimately happens in 2010 could depend on how closely the electoral backdrop next year resembles 1994. At this point, there are some strong similarities. Like Bill Clinton a decade and a half ago, Obama is an ambitious young Democratic president who has seen his poll numbers drop sharply in the opening months of his administration. And like Clinton, Obama has invested a good bit of his political capital into a massive effort to overhaul the nation's health care system. As in 1994, it is so complex an undertaking that foes are finding it much easier to pillory the project as "big government" than supporters are able to defend it as needed reform.
Yet will history necessarily repeat itself? Even on election eve in 1994, only the most optimistic Republicans were forecasting a GOP congressional takeover. The Democrats were largely blindsided.
That is not the case these days. The prospect of a Democratic debacle in 2010 is widely discussed, giving the party's most endangered congressional incumbents time to prepare as best they can. For many of them, that means joining the fiscally conservative "Blue Dog Coalition" and raising large amounts of early money.
No matter which way it plays out, though, there is already evidence that the basic nature of the nation's political map is changing. For most of the last quarter century, there was a steady trend toward increased congruency in presidential and congressional voting, with more and more districts favoring candidates for president and Congress from the same party.
In 1984, in the midst of an era when voters regularly elected Republican presidents and Democratic Congresses, there were 190 districts with a split result. But as Republicans began to pick off many of these exposed Democratic seats, the number of split-ticket districts began to drop--to 86 in 2000, and to 59 four years later, the lowest figure since World War II. But in 2008, the number of split-ticket districts bounced back to 83.
It is a group with mixed membership--49 House Democrats in districts that voted for GOP presidential candidate John McCain, 34 congressional Republicans in districts that were carried by Obama. In short, if the political winds shift again before the 2010 election, political survival would not just be a concern for dozens of House Democrats. It would become a top priority for a number of Republican representatives as well.
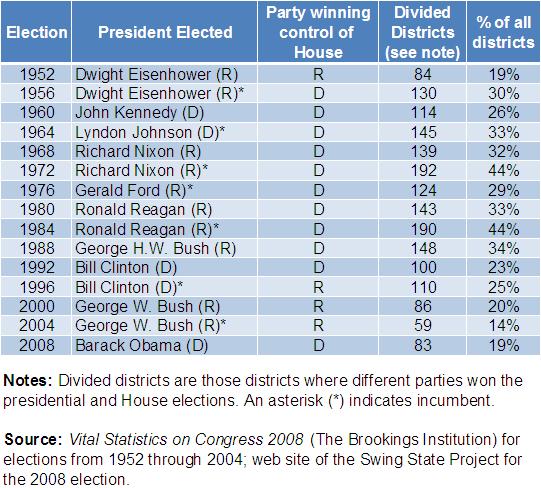
A Comeback in 2008 for Split-Ticket Districts
|
Through much of the last half of the 20th century, voters elected Republican presidents with Democratic Congresses. The result was a period from 1956 to 1996 with at least 100 split-ticket districts in each election, where one party carried the vote for president (often a Republican) while another party won the House seat (frequently a Democrat). In recent years, the number of split-ticket districts declined as the national map of presidential and congressional voting became more congruent. But in the election of 2008, there was an uptick in split-ticket districts, as 83 House winners--49 Democrats and 34 Republicans--successfully ran against the presidential tide in their districts. |
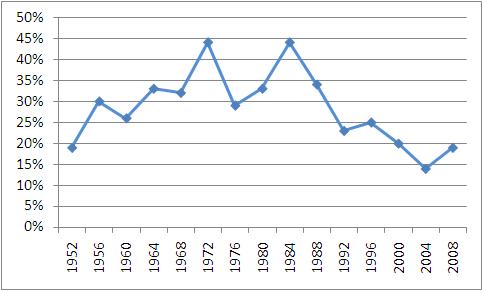
The below graph shows the percentage of the nation's 435 congressional districts that were won by a presidential candidate of one party and a House candidate of another party, in each presidential election year.
Rhodes Cook is a senior columnist at the Center for Politics at the University of Virginia
See Other Commentary by Rhodes Cook
See Other Political Commentary
Views expressed in this column are those of the author, not those of Rasmussen Reports.
Related Articles


Rasmussen Reports is a media company specializing in the collection, publication and distribution of public opinion information.
We conduct public opinion polls on a variety of topics to inform our audience on events in the news and other topics of interest. To ensure editorial control and independence, we pay for the polls ourselves and generate revenue through the sale of subscriptions, sponsorships, and advertising. Nightly polling on politics, business and lifestyle topics provides the content to update the Rasmussen Reports web site many times each day. If it's in the news, it's in our polls. Additionally, the data drives a daily update newsletter and various media outlets across the country.
Some information, including the Rasmussen Reports daily Presidential Tracking Poll and commentaries are available for free to the general public. Subscriptions are available for $4.95 a month or 34.95 a year that provide subscribers with exclusive access to more than 20 stories per week on upcoming elections, consumer confidence, and issues that affect us all. For those who are really into the numbers, Platinum Members can review demographic crosstabs and a full history of our data.
To learn more about our methodology, click here.