This Century’s Electoral College Trends
A Commentary By Kyle Kondik
Tracking the strength of the parties in all 50 states
KEY POINTS FROM THIS ARTICLE
— Despite persistently close presidential elections this century, many states have been becoming dramatically more Democratic or Republican compared to the nation over the course of the last decade and a half.
— Generally speaking, the Sun Belt and West are trending Democratic. The Midwest and North more broadly, along with Greater Appalachia, are trending Republican.
— Map 1 at the end of this article shows the trends, and the charts throughout show the trend of every state in its presidential lean relative to the nation from 2000 to 2016.
What does it mean for a state to “trend,” and what are the trends?
It has become common to describe our home state of Virginia as a state that is “trending Democratic.” That’s an observation we agree with — we used that exact term a few weeks ago in our initial Electoral College ratings. But what are we really saying when we use a term like that?
What follows is an explanation, and an exploration, of the recent presidential voting trends in Virginia and the other 49 states.
A quick look at recent Electoral College history would seem to confirm the Democratic trend in Virginia. Virginia voted 10 straight times for the GOP ticket before voting Democratic the last three times. But let’s dig a little bit deeper. As a note, throughout this article, we’ll be using the two-party presidential vote, which just measures Democratic vs. Republican performance. It’s a way to compare two-party performance across elections, when the two major parties remain constant but the presence of credible third-party candidates ebbs and flows.
The most dramatic recent shift in Virginia came from 2004 to 2008, when the Old Dominion moved from giving Democrat John Kerry just 45.9% of the two-party vote to giving Democrat Barack Obama 53.2%, a 7.3-point jump in vote share (and a 14.6-point jump in margin). Of course, the nation as a whole moved from 48.8% for Kerry in 2004 to 53.7% for Obama in 2008, an increase of 4.9 points. Part of the Virginia story is that it shifted more dramatically from 2004 to 2008 toward the Democrats than the nation as a whole did.
On the other hand, since the shift, the Democratic two-party share in Virginia has actually fallen, to 52.0% in 2012 and 52.8% in 2016. By that standard, Democratic strength in Virginia actually backslid in both 2012 and 2016 when compared to 2008 (53.2%). So what’s the trend?
Well, compared to the national voting in each of the last three presidential elections, Virginia is getting more Democratic. In 2008, Virginia’s Democratic share was about a half point less than the national percentage, meaning that Virginia was slightly more Republican than the nation that year. By 2012, Virginia’s presidential margin was in exact alignment with the national voting: Obama won 52.0% in both. That made Virginia more Democratic relative to the nation in 2012 than it had been in 2008. And Virginia voted clearly more Democratic than the nation in 2016: Hillary Clinton (with Virginian Tim Kaine as her running mate) won Virginia with 52.8% of the two-party vote while winning 51.1% nationally.
We can use a statistic, called presidential deviation, to show this trend. To calculate presidential deviation in this article, we are taking the national Democratic two-party vote share and subtracting it from the Democratic vote share in a given state in a given year. A positive number means the state was more Republican in that election; a negative number means it was more Democratic. The deviation is rounded to the nearest integer. Let’s see how this works out for Virginia across the last three elections:
2008: 53.7% nationally – 53.2% in Virginia = 0.5, rounds up to R +1.
2012: 52.0% nationally – 52.0% in Virginia = 0, so no presidential deviation at all.
2016: 51.1% nationally – 52.8% in Virginia = -1.7, rounding to -2 or D +2 (remember, negative numbers indicate a Democratic lean here, while positive ones represent a Republican lean).
So the Virginia trend over the last three elections is R +1, 0, and D +2. When we say Virginia is “trending Democratic,” that’s what we’re saying: The state is becoming more Democratic compared to the nation.
As an addendum to our Electoral College ratings release from a few weeks ago, we thought we’d track the presidential voting in each state relative to the nation over the last five elections to give readers a sense of where each state is trending. We split the 50 states into 10 different regional categories, loosely based on the regions and divisions of the U.S. Census Bureau (we made some adjustments to keep a manageable number of states in each category so that the accompanying charts didn’t become too unwieldy to follow). As you follow along, remember that the more positive the number, the more Republican a state is, and the more negative, the more Democratic a state is. States where the line slants upward from 2000 to 2016 are becoming more Republican relative to the nation; states where the line slants downward from 2000 to 2016 are becoming more Democratic relative to the nation.
A couple of notes: I calculated these presidential deviations, which I used for my 2016 book on Ohio’s presidential voting history (The Bellwether), using data from Dave Leip’s Atlas of U.S. Presidential Elections. This statistic is a little different than the commonly-cited Partisan Voter Index, created by our friends at the Cook Political Report. The PVI uses an average of the last two presidential elections to determine the lean in a given district; this presidential deviation calculation only involves how much more Republican or Democratic a state was compared to the nation in a given year.
Also, keep in mind that the key on the y-axis showing the range of presidential deviations from high positive numbers (most Republican) to high negative (most Democratic) differs from chart to chart, so re-orient yourself as you move from region to region. In any event, the closer any state is to zero in a given year, the closer it was to voting the same way the nation voted in that year.
We’ll start out west and move eastward.
Chart 1: Presidential deviation of the Pacific states, 2000-2016 (AK, CA, HI, OR, WA)
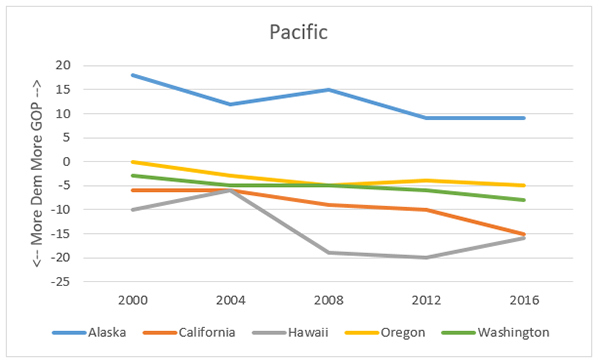
This region contains all of the states that touch the Pacific Ocean, so the West Coast plus Alaska and Hawaii. Alaska stands alone from the other four through its Republican lean, which has become less pronounced this century but is still clear. Meanwhile, the three West Coast states have all become more Democratic; Oregon remains the most competitive but in a close national election the Democratic candidate should carry it easily. Hawaii has remained quite Democratic this whole century, but it was less Democratic in 2000, 2004, and 2016, when Barack Obama (who was born in Hawaii) was not on the ballot.
Chart 2: Presidential deviation of the Northern Interior West states, 2000-2016 (ID, MT, ND, SD, WY)
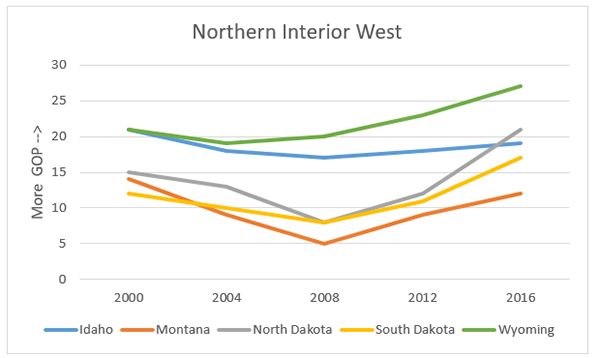
All five of these sparsely-populated states are safely Republican — so much so that this region does not require us to display negative numbers on the y-axis in order to show Democratic leans. All of these states give routinely big margins to Republican presidential candidates, although Montana did come within a couple of points of voting for Obama in 2008. Its dalliance with the Democrats at the presidential level was short-lived, although it does still have a Democratic senator, the recently-reelected Jon Tester. Democrats started the century holding all four Senate seats from the Dakotas; they hold none now as both GOP-heavy states have become even more sharply Republican.
Chart 3: Presidential deviation of the Southwest states, 2000-2016 (AZ, CO, NV, NM, UT)
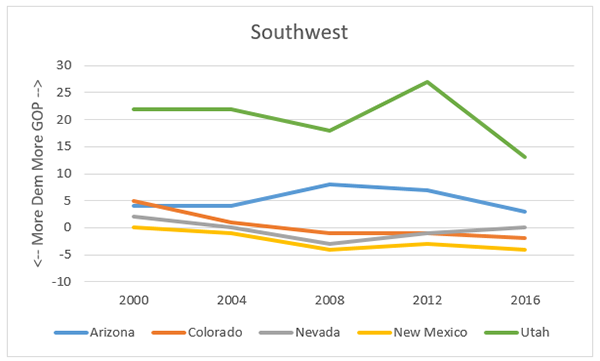
Other than Utah, this is a competitive region. Note how Nevada, in gray, hugs the zero line, an indication of its status as a strong presidential bellwether in recent years. Colorado, meanwhile, is trending Democratic, but it’s not quite as Democratic as New Mexico. Arizona remains right of center, although its GOP lean was less pronounced in 2016 than it was in 2008 (when home-state Sen. John McCain was the GOP nominee) and 2012. Compared to 2000 and 2004, though, Arizona’s lean compared to the nation hasn’t changed much. Utah is clearly the most Republican of the bunch; its big drop from 2012 to 2016 can be explained in part by Mitt Romney (a Mormon who is now the state’s junior senator) being an unusually strong GOP presidential nominee for the majority-Mormon state in 2012 and Donald Trump being an unusually weak GOP nominee for Mormons in 2016. Also, we see here a limitation of using just the two-party vote in these calculations: Mormon third-party conservative presidential candidate Evan McMullin received 21% of the vote in Utah in 2016, but those votes are disregarded here and just the two-party margin is used. One wonders how those McMullin voters would have split if they just had to choose between Trump and Clinton. In any event, the giant dip in GOP strength in Utah from 2012 to 2016 is not indicative, to us, of some sort of more meaningful pro-Democratic trend there.
Chart 4: Presidential deviation of the South Central states, 2000-2016 (AR, LA, OK, TX)
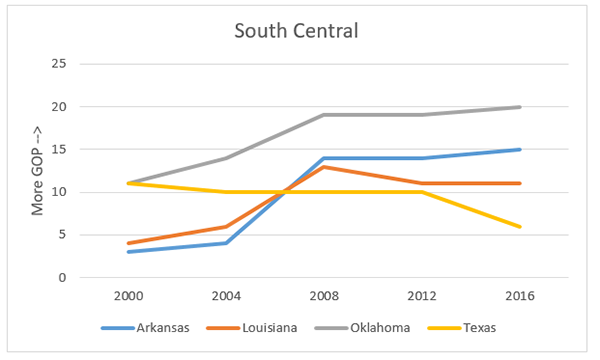
At the start of the century, Arkansas and Louisiana still could have been classified as swing states — both voted for Bill Clinton twice in the 1990s and as recently as 2004 each had two Democratic senators apiece. But both have become safely Republican at the presidential level, joining the even more Republican Oklahoma in that category. Meanwhile, Texas’ presidential lean was very steady until 2016, when it took a clear dip and became less Republican relative to the nation. Democrats are hopeful that the 2016 and 2018 results indicate that this diversifying and growing state will trend toward them over time, although it still clearly resides to the right of the nation as a whole.
Chart 5: Presidential deviation of the Western Midwestern states, 2000-2016 (IA, KS, MN, MO, NE)
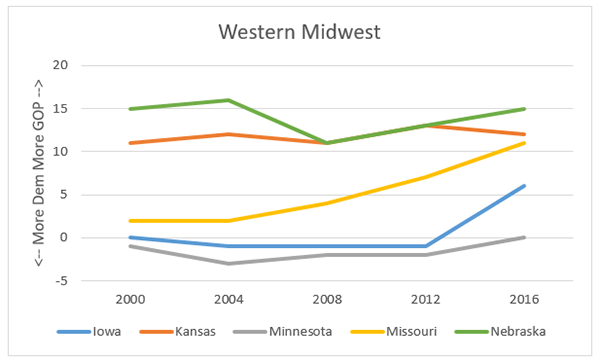
Kansas and Nebraska have some of the longest GOP lineage in the nation, and their GOP leans have not changed much over the last several elections. Missouri, a state once seen as a bellwether, has joined its two western neighbors in the safe Republican camp. Iowa took a sharp turn to Trump in 2016, although prior to that it had voted more Democratic than the nation in seven of the eight previous presidential elections (its lean was Republican before that). Minnesota, meanwhile, has the longest streak of voting Democratic of any state in the nation, dating back to 1976, but that streak belies its competitiveness: Note that its Democratic leans relative to the nation have only been relatively modest in recent years, and 2016 was actually the first time since 1952 when the two-party margin in Minnesota was to the right of the nation, albeit only very slightly. It is by no means a safe Democratic state.
Remember that Nebraska awards electoral votes by congressional district. Under the current map, the First and Third are safely Republican, but the Second has only a relatively small Republican lean and starts this cycle as a Toss-up electoral vote.
Chart 6: Presidential deviation of the Eastern Midwestern states, 2000-2016 (IL, IN, MI, OH, WI)
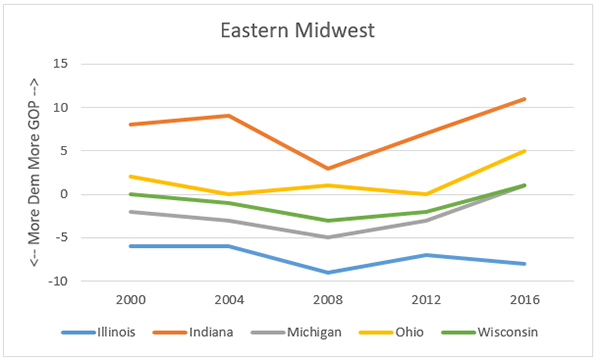
Illinois is clearly the most Democratic state of the Midwest — it’s sort of the Democratic version of Republican Missouri, both classic bellwether states that have since diverged. Indiana is the most Republican of the core Midwestern states, and even though Obama carried it in 2008, its Republican lean that year (and in the other years) is still pronounced compared to its regional counterparts. One can see the Democrats’ close calls in Wisconsin in both 2000 and 2004 on this chart, as well as Obama’s 2008 blowout and then the trend back toward the GOP. Michigan, more Democratic than Wisconsin earlier in the decade, converged with the Badger State in 2016. Much more often than not, Ohio has voted to the right of the nation in presidential elections, but only slightly in recent decades before Trump’s strong showing called the state’s bellwether status into serious question.
Chart 7: Presidential deviation of the Greater Appalachian states, 2000-2016 (AL, KY, MS, TN, WV)
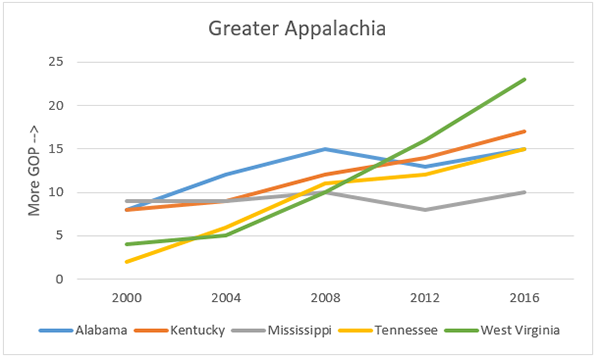
Democratic strength has collapsed across Appalachia, with West Virginia (the only state wholly considered Appalachian by the Appalachian Regional Commission) taking a dramatic turn toward the Republicans throughout the century. But the lines are generally slanting upward, toward the Republicans, in all of these states, with Mississippi an exception. Its racially-polarized voting seems to be keeping the state in something of a stasis: Mississippi has the largest percentage of African-American residents of any state, but their overwhelmingly Democratic voting is swamped by whites’ numerical advantage and overwhelmingly Republican voting. None of these states will be two-party competitive in the 2020 presidential election.
Chart 8: Presidential deviation of the South Atlantic states, 2000-2016 (FL, GA, NC, SC, VA)
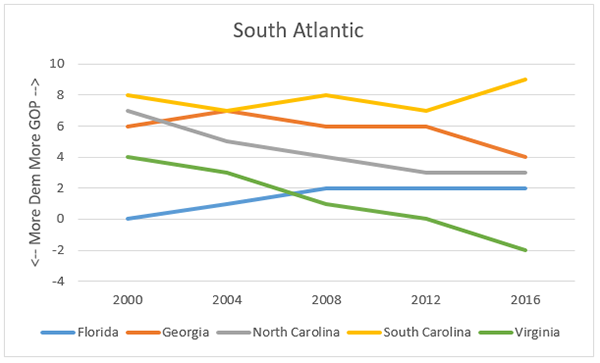
Virginia’s Democratic trend, noted above, becomes more apparent when 2000 and 2004 are added: The state moved from R +4 in 2000 to D +2 in 2016. Democrats are hopeful that Georgia and North Carolina, which share some demographic similarities to Virginia and feature the kind of large, growing urban centers that have become so important to Democratic performance, will shift similarly to Virginia over time. But note how Georgia and North Carolina started the century with more pronounced Republican leans than Virginia did, and while they have trended to be less Republican, they remain to the right of the nation. So too does Florida, which has not voted more Democratic than the nation since 1976, when southerner Jimmy Carter became the last Democrat to largely sweep the South (Virginia, which now stands out as the most Democratic state in the old Confederacy, was the only one that didn’t vote for Carter that year). South Carolina has remained consistently, and significantly, more Republican than the nation.
Chart 9: Presidential deviation of the Middle Atlantic states, 2000-2016 (DE, MD, NJ, NY, PA)
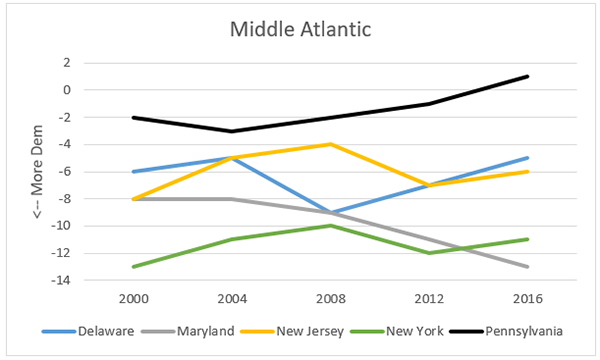
Pennsylvania may at the moment be the key swing state in presidential elections; it’s also the only competitive state among these five. It resided on the more Democratic side of the ledger before 2016, but its Democratic lean in recent years was not very pronounced and there was a trend toward the Republicans even before Trump became the first Republican since Thomas Dewey in 1948 to perform better in the two-party vote there than he did nationally. The other four states reside in a safe Democratic zone, with Maryland trending clearly more Democratic over time.
Chart 10: Presidential deviation of the New England states, 2000-2016 (CT, MA, ME, NH, RI, VT)
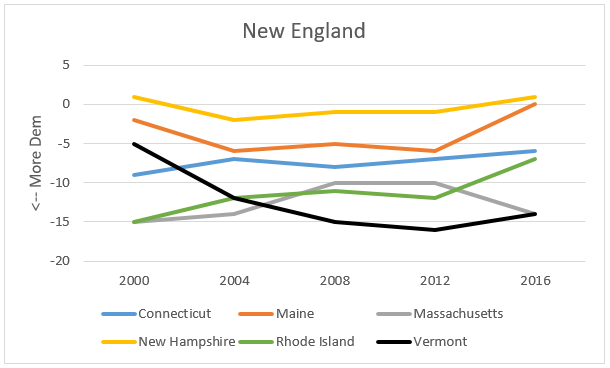
Four of the six New England states are totally safe for the Democratic presidential nominee: Connecticut, Massachusetts, Rhode Island, and Vermont. We noted Trump’s relatively decent performance in Rhode Island a few weeks ago, but it’s also clear that the Ocean State remains considerably more Democratic than the national average. New Hampshire has been very competitive throughout the century after residing frequently to the right of the nation during the past century. Maine also turned sharply toward the Republicans in 2016, and remember that it allocates its electoral votes by congressional district. The First is safely Democratic, but the Second now seems to lean Republican after Trump carried it by 10 points in 2016.
Conclusion
Let’s look at how the states have changed from 2000 compared to 2016, both close elections where Republican presidential nominees overcame small popular vote losses to nonetheless capture the Electoral College.
Map 1 compares the presidential deviations of each state in 2000, George W. Bush’s first election, to 2016, Donald Trump’s first election.
Map 1: Changes in presidential deviation by state, 2000 vs. 2016
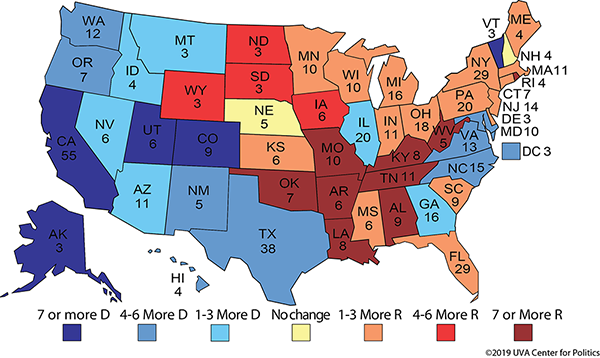
Note: The numbers listed with the state abbreviations are their respective number of electoral votes.
Some broad patterns emerge. Generally speaking, much of the West and parts of the South were more Democratic relative to the national voting in 2016 than they were in 2000, while much of the Midwest, Greater Appalachia, and New England were more Republican relative to the nation in 2016 than they were in 2000.
Now, just because states like Rhode Island (much more Republican) and Utah (much more Democratic) stand out on Map 1, they still start out the next election as Safe for their usual parties in Map 2, which is our previously released initial ratings of the 2020 Electoral College.
Map 2: 2020 Crystal Ball Electoral College ratings
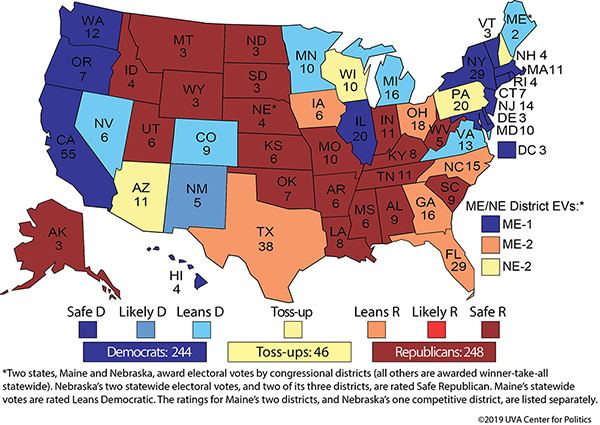
Think of Map 2 as a reality check of the trends in Map 1. Just because states may be trending one way or the other doesn’t mean that they are truly competitive. But this exercise does help to show how even over the course of just 16 years, the relative positioning of the states in the Electoral College has in many instances shifted so much.
Kyle Kondik is a Political Analyst at the Center for Politics at the University of Virginia and the Managing Editor of Sabato's Crystal Ball.
See Other Political Commentary by Kyle Kondik.
See Other Political Commentary.
Views expressed in this column are those of the author, not those of Rasmussen Reports. Comments about this content should be directed to the author or syndicate.
Rasmussen Reports is a media company specializing in the collection, publication and distribution of public opinion information.
We conduct public opinion polls on a variety of topics to inform our audience on events in the news and other topics of interest. To ensure editorial control and independence, we pay for the polls ourselves and generate revenue through the sale of subscriptions, sponsorships, and advertising. Nightly polling on politics, business and lifestyle topics provides the content to update the Rasmussen Reports web site many times each day. If it's in the news, it's in our polls. Additionally, the data drives a daily update newsletter and various media outlets across the country.
Some information, including the Rasmussen Reports daily Presidential Tracking Poll and commentaries are available for free to the general public. Subscriptions are available for $4.95 a month or 34.95 a year that provide subscribers with exclusive access to more than 20 stories per week on upcoming elections, consumer confidence, and issues that affect us all. For those who are really into the numbers, Platinum Members can review demographic crosstabs and a full history of our data.
To learn more about our methodology, click here.