Religion in Politics: A Look at Data from the New American Values Atlas
A Commentary By Kyle Kondik and Geoffrey Skelley
On Wednesday, the Public Religion Research Institute released its new American Values Atlas. It is full of information regarding the American public’s religious identity, political views on hot-button issues such as abortion and immigration, and demographic information for regions, states, and major metropolitan areas. This atlas should prove to be a highly useful resource, especially because of the incomplete state-by-state data in recent exit polls.
Using this treasure trove of new data, the Crystal Ball took a look at three major religious groups in the American public: white evangelicals, the unaffiliated, and Catholics.
White evangelicals and Romney
It’s no secret that white evangelical Christians voted heavily for Mitt Romney in 2012, a notable fact given his Mormon faith. Many commentators had wondered if Romney’s performance among voters in this crucial GOP base group would suffer. But according to the exit poll, 78% of them backed the Republican nominee, a four-point improvement over John McCain’s performance in 2008. This is a testament to the partisan polarization that has taken deep root in the United States, almost across the board. Let’s see just how consequential this mode of identity seemed to be for the election outcomes in many states.
Table 1: Percentage of state population identifying as white evangelical and percentage vote for Romney
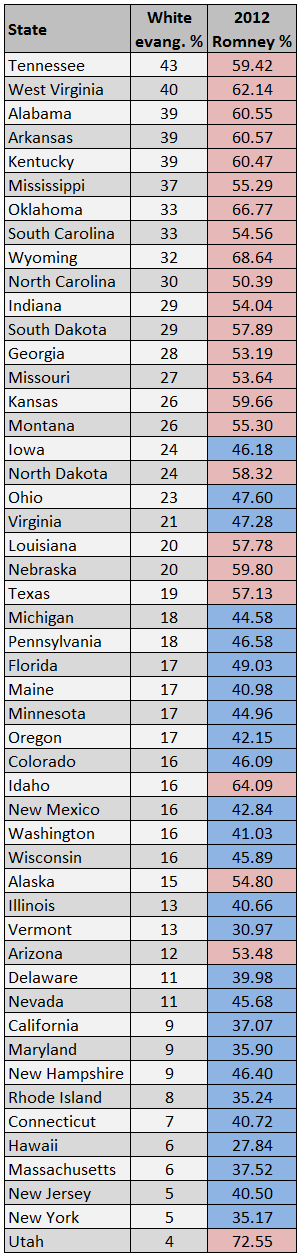
Source: Public Religion Research Institute, Dave Leip's Atlas of U.S. Presidential Elections
Take a look at Table 1 above, which lists the states by the percentage of the population that identifies as white evangelical Protestant and the 2012 vote for Romney in each state. Tellingly, the 16 states with the largest percentages of white evangelicals all went for the Republican, and out of 50 states, 20 of the 25 with the largest percentages backed Romney. In other words, of the 24 states Romney won in 2012, five out of six were in the top half of states with the greatest proportions of white evangelicals. The four outside of that group were Alaska, Arizona, Idaho, and, unsurprisingly, Utah. And at least in the cases of the latter three, they fall in the top six states in terms of Mormon percentage of the population, a group that voted overwhelmingly for its coreligionist in 2012. (Utah and Idaho have the two largest Mormon percentages at 56% and 20%, respectively.)
The simple linear regression in Chart 1 shows a solidly positive relationship between the portion of a state’s population identifying as white evangelical Christian and its support for Romney. There is a relatively strong correlation of .65 between the two variables.
Chart 1: Simple linear regression of white evangelical percentage and Romney percentage
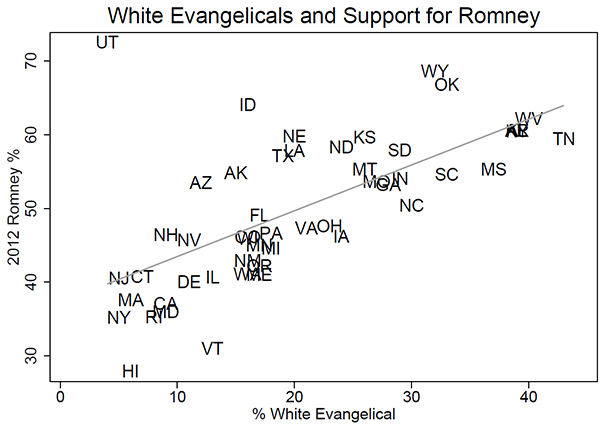
Note: Doesn’t include Washington, DC.
While race certainly plays a role in all this -- the group in question is denoted as white evangelicals, after all -- it’s not the whole story. On the one hand, the exit poll found Romney won 59% of white voters. But on the other hand, using the PRRI data, the correlation between the white percentage of the population by state and its support for Romney is only .35, far less than .65.
The unaffiliated
Religiosity certainly matters to political identity, especially given the potency of policy debates over issues like same-sex marriage and abortion. Polling from Gallup in early 2014 showed that the 19 states with the largest concentrations of “very religious” Americans all voted for Romney in 2012. The 2012 exit poll found a very clear increase in support levels for Romney among voters who attended church more often: Romney won weekly church attendees 58%-41% and those who attended “more than weekly” 63%-36%. The flipside of this is also apparent: Less religious voters tended to vote more for Obama. Obama won monthly attendees 55%-44%, Easter-Christmas churchgoers (“few times a year”) 56%-42%, and those who said they never attended 62%-34%.
Thus, just as the states with the most religious voters usually supported Romney, the states with larger numbers of less religious voters were likely to back Obama in 2012.
When someone describes him- or herself as “unaffiliated,” it doesn’t necessarily mean the individual isn’t religious, but it does suggest that religion is probably not a central part of life. As shown in Chart 2, a simple regression analysis of PRRI’s state-level data for the unaffiliated and 2012 state support for President Obama shows a positive relationship, with a correlation of .40 between the two variables. This is a fairly mild relationship, but it does at least suggest a connection between decreased religiosity and increased support for Democrats. Of the 24 states with the largest percentages of unaffiliated (22% or more), three-fourths supported Obama. Conversely, the states with the smallest percentages of unaffiliated nearly all backed Romney: of the 14 states with 18% or less unaffiliated, 13 supported the Republican, with only New Jersey (with 18% unaffiliated) voting for Obama.
Chart 2: Simple linear regression of unaffiliated percentage and support for Obama
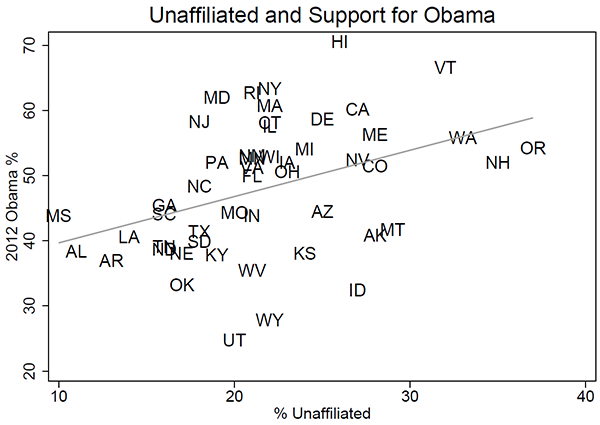
Note: Doesn’t include Washington, DC.
Catholic voting
Avowed anti-Catholicism is, fortunately, not really a part of American politics anymore. While there has only been one Catholic president, John F. Kennedy, Catholicism hardly seems like a mark against any politician these days. For example, the new Congress opened with a record number of 164 Catholics (30.7% of the 535 total membership). The lack of anti-Catholic sentiment can also be seen in the composition of the Supreme Court, where six justices are Catholic (and the other three are Jewish, another religious group that has faced persecution throughout history).
But opposition to the Catholic Church used to play a major role in American politics. In the pre-Civil War era, the Whigs (and later the Republicans) were generally the more anti-Catholic party, in part because Catholic Irish immigrants were such an important voting bloc in the Democratic coalition. The phrase “Rum, Romanism, and Rebellion” originated in the 1884 election as a Republican attack on the Democrats, with “Romanism” referring to the Catholic Church. (Historians now remember the attack as a perhaps-fatal gaffe in an election that Democrat Grover Cleveland would win.) New York Gov. Al Smith, the 1928 Democratic presidential nominee and a Catholic, lost in a wipeout, and his religion (and opposition to Prohibition, which was in effect at the time) contributed to his failure to carry several Southern states that had voted Democratic for president since Reconstruction. However, Smith won two heavily Catholic states above the Mason-Dixon Line: Massachusetts and Rhode Island, which prior to that election were reliably Republican. According to the survey, Massachusetts and Rhode Island currently have the highest percentage of white Catholic residents.
Kennedy’s groundbreaking election in 1960 had a great deal to do with religion: Kennedy won more than three-fourths of Catholics, and Richard Nixon won about two-thirds of Protestants.
As we noted, more than 150 years ago the Whigs (in many ways the antecedents to the Republicans) were generally the more anti-immigration party while the Democrats were generally the more pro-immigration party and the political home for recent Catholic immigrants (primarily Irish and German). The more things change, the more they remain the same. In modern politics, the Republicans remain the party that is less pro-immigration than Democrats, and Catholic immigrants (this time, Hispanics) again identify more with the Democrats.
(Much of the history noted above is described in historian Morton Keller’s excellent America’s Three Regimes, which we highly recommend.)
In the exit poll era (beginning in 1972), white Catholics have generally voted about the same as the nation, at least through 1996. In seven elections, Democrats won three and lost four shots at the presidency, winning an average of 44% of the vote. Amongst white Catholics, the Democrat also got an average of 44%. In this same time period, whites as whole were more Republican: They gave just 39% of the vote to the Democratic nominee, on average, in these seven elections.
But from 2000 on, white Catholics became clearly more Republican. Over the past four elections, the nation gave an average of 50% of the vote to the Democratic nominee, with an average of 41% of whites going Democratic and 44% of white Catholics voting Democratic. So white Catholics remain a bit more Democratic than whites as a whole, but they aren’t as reflective of the nation as they used to be.
In 2012 Obama won Catholics 50%-48% according to the exit poll, about the same as his 51%-47% national victory. The 2012 exit poll does not break down nonwhite Catholics as a separate group, but given that 18% of the electorate was white Catholic and 25% was Catholic overall, about seven percentage points worth of voters therefore were nonwhite Catholic. The PRRI survey shows that only 2% of the adults surveyed were Catholics who were neither Hispanic nor white, so the lion’s share of the nonwhite Catholics in the exit poll were Hispanics. Because Obama got 40% among white Catholics and 50% overall, we can estimate that Obama won about 75% of nonwhite (mostly Hispanic) Catholics.
Charts 3 and 4 display simple regression analyses of the Hispanic and white Catholic percentages in each state compared with 2012 support for Obama. Examining the state-level Hispanic Catholic numbers and support for Obama doesn’t tell us much, even though the exit poll found that 71% of Latino voters cast ballots for the Democrat in 2012. The correlation between the percentage of the population that identifies as Hispanic Catholic and 2012 support for Obama is weak, .21 (Chart 3). Only six states have 10% or larger cohorts of Hispanic Catholics, meaning their overall voting influence on 2012 state-by-state outcomes was relatively small outside of the few states with large Latino populations (e.g., California or New Mexico). Texas, with the third-largest percentage of Hispanic Catholics, still went solidly Republican in 2012. We can only assume Texas Latino voters went big for Obama again in 2012 -- he won 63% of the group’s vote in 2008 there -- because regrettably there was no exit poll for the Lone Star State in 2012.
Chart 3: Simple linear regression of Hispanic Catholic percentage and 2012 support for Obama
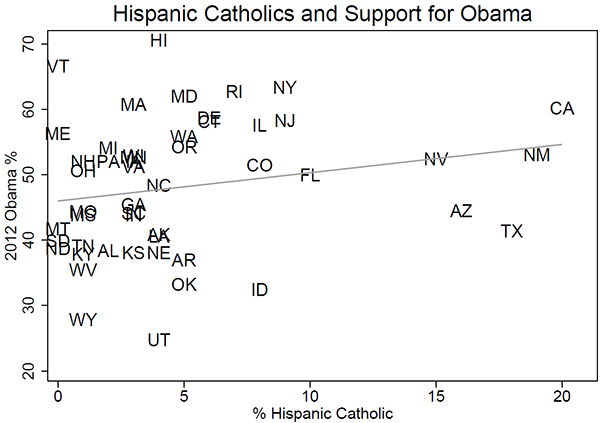
Note: Doesn’t include Washington, DC.
Examining white Catholics tells us a little bit more. The correlation between the percentage of the population in each state that identifies as white Catholic and 2012 support for Obama is .43 (Chart 3). While the correlation is mild in strength, it’s much stronger than in the case of Hispanic Catholics. The moderate correlation follows the logic that white Catholics are, on the whole, more inclined to vote Democratic than Republican, at least compared to their white evangelical counterparts. White Catholics voted for Romney 59%-40% (about the same as whites as a whole) versus the 78%-21% Romney edge among white evangelicals. So while Obama didn’t do well among white Catholics, he unquestionably did better among them than white evangelicals. Looking at the states, the three with the largest white Catholic populations -- Rhode Island, Massachusetts, and Connecticut -- are solidly blue and are the only states that are at least 30% white Catholic, meaning that those states’ white Catholic populations have the size to clearly influence statewide voting outcomes. Of the states that are at least 20% white Catholic, only North Dakota did not back Obama in 2012.
Chart 4: Simple linear regression of white Catholic percentage and 2012 support for Obama
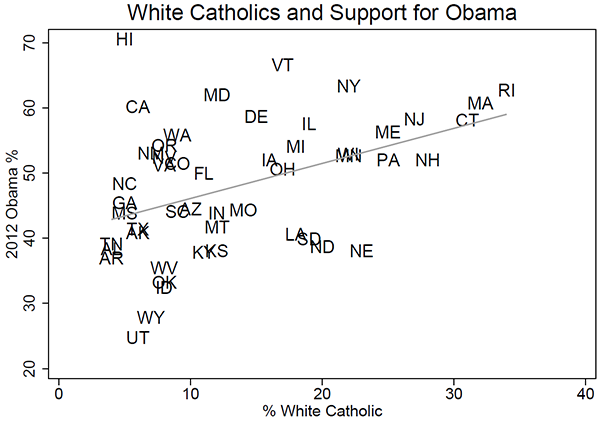
Note: Doesn’t include Washington, DC.
Conclusion
Outside of partisan identity itself, race may well be the most vital factor in understanding politics today. Yet there is no question that different value systems based on religious beliefs (or a lack thereof) also play a notable role in determining political identity. To some extent, the party bases reflect this. Social conservatives, many of whom are evangelicals, are major players in the Republican base and will undoubtedly make their voices heard in the coming 2016 presidential nomination battle. Meanwhile, many liberal Democrats fall into the category of religiously unaffiliated, and they are strongly supportive of same-sex marriage and abortion rights. Given the significant pull of such issues on both the right and left, religion will continue to be an essential part of any discussion of contemporary American politics.
Kyle Kondik is a Political Analyst at the Center for Politics at the University of Virginia.
Geoffrey Skelley is the Associate Editor at the Center for Politics at the University of Virginia.
See Other Political Commentary by Kyle Kondik
See Other Political Commentary by Geoffrey Skelley
See Other Political Commentary
Related Articles


Rasmussen Reports is a media company specializing in the collection, publication and distribution of public opinion information.
We conduct public opinion polls on a variety of topics to inform our audience on events in the news and other topics of interest. To ensure editorial control and independence, we pay for the polls ourselves and generate revenue through the sale of subscriptions, sponsorships, and advertising. Nightly polling on politics, business and lifestyle topics provides the content to update the Rasmussen Reports web site many times each day. If it's in the news, it's in our polls. Additionally, the data drives a daily update newsletter and various media outlets across the country.
Some information, including the Rasmussen Reports daily Presidential Tracking Poll and commentaries are available for free to the general public. Subscriptions are available for $4.95 a month or 34.95 a year that provide subscribers with exclusive access to more than 20 stories per week on upcoming elections, consumer confidence, and issues that affect us all. For those who are really into the numbers, Platinum Members can review demographic crosstabs and a full history of our data.
To learn more about our methodology, click here.