Unemployment and the Presidential Race
A Commentary By Geoffrey Skelley
Back in September, the Crystal Ball examined the possible electoral impact of state-by-state unemployment figures because, after all, presidents are elected in 51 individual battles (50 states plus Washington, D.C.)
With the January jobs report to be released this Friday, we thought we would once again examine the state-by-state numbers, which are shown in Chart 1. Since our analysis of the August numbers, the nation’s unemployment rate has fallen from 9.1% to 8.5% (as of December).
Chart 1: State unemployment rates
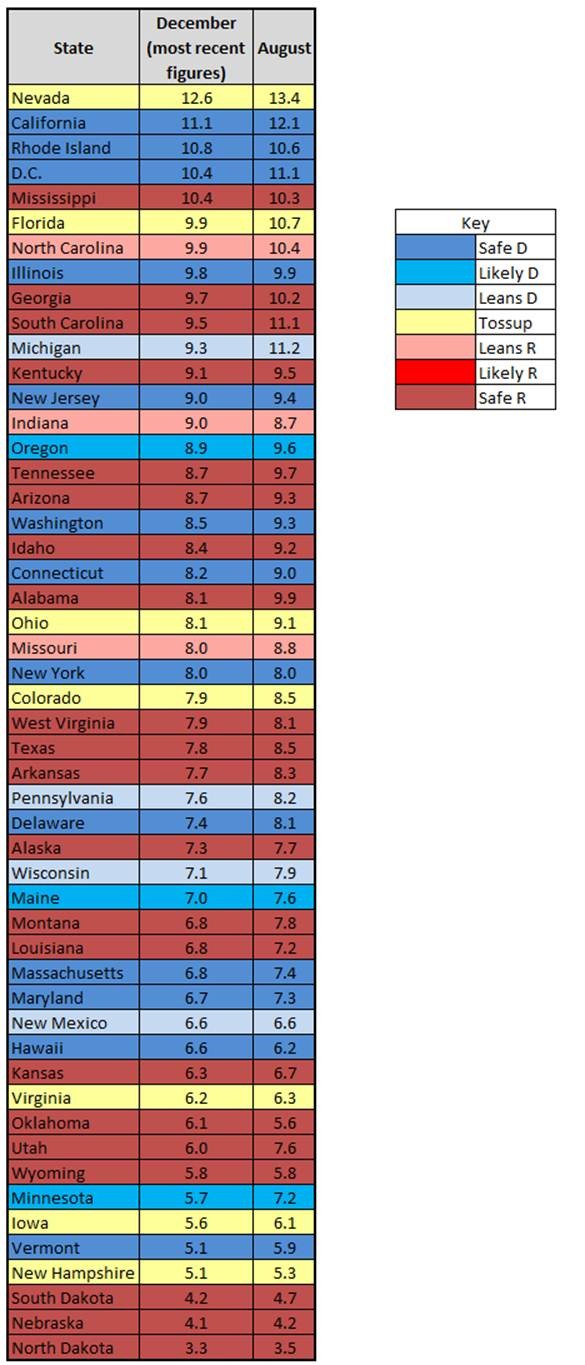
Source: U.S. Department of Labor Bureau of Labor Statistics
What do these numbers mean for November? In many places, probably not much. Even if California’s unemployment rate remains at around 11%, President Obama will almost certainly carry the state. At the same time, North Dakotans are not planning to reward the president with their three electoral votes despite enjoying the lowest unemployment rate in the country.
But the numbers are worth monitoring, especially if the election is close (and we expect it will be). For instance, Nevada is a toss up state that, because of its changing demographics and politics, might be leaning toward President Obama. However, the terrible state of the Silver State’s economy -- it has the highest unemployment rate in the nation at 12.6% -- might be a drag on Obama. Perhaps unhappiness with the economy and another demographic group -- the 11% of Nevada’s population who are Mormons -- could tilt the state toward Mitt Romney, assuming he wins the Republican nomination.
Then there are toss ups such as Virginia (6.2%) and Iowa (5.6%), which have jobless rates considerably lower than the national average. That could make these states more likely to support the status quo and vote for the incumbent. For the same reason, recent good news regarding the economies of many Rust Belt states could improve Obama’s reelection chances.
States that the Crystal Ball views as leaning one way or the other will also be affected to some degree by their individual unemployment rates. Obama barely won North Carolina in 2008, and the state’s 9.9% unemployment rate helps explain why we believe, at the moment, the Republicans are slightly favored to take back the Tar Heel State in November. Conversely, New Mexico, a state with a large Hispanic population that has been trending more Democratic, has a fairly low unemployment rate, making it more likely to remain in the president’s column.
Again, unemployment numbers, national or statewide, are far from a sure-fire determiner of a November result. But in a state-by-state election, these numbers will help determine how the candidates craft their messages and, perhaps, how open voters are to making a change in the White House.
Geoffrey Skelley is a political analyst for Center for Politics at the University of Virginia.
See Other Commentary by Geoffrey Skelley
See Other Commentary by Larry Sabato
See Other Political Commentary
Views expressed in this column are those of the author, not those of Rasmussen Reports. Comments about this content should be directed to the author.
Related Articles


Rasmussen Reports is a media company specializing in the collection, publication and distribution of public opinion information.
We conduct public opinion polls on a variety of topics to inform our audience on events in the news and other topics of interest. To ensure editorial control and independence, we pay for the polls ourselves and generate revenue through the sale of subscriptions, sponsorships, and advertising. Nightly polling on politics, business and lifestyle topics provides the content to update the Rasmussen Reports web site many times each day. If it's in the news, it's in our polls. Additionally, the data drives a daily update newsletter and various media outlets across the country.
Some information, including the Rasmussen Reports daily Presidential Tracking Poll and commentaries are available for free to the general public. Subscriptions are available for $4.95 a month or 34.95 a year that provide subscribers with exclusive access to more than 20 stories per week on upcoming elections, consumer confidence, and issues that affect us all. For those who are really into the numbers, Platinum Members can review demographic crosstabs and a full history of our data.
To learn more about our methodology, click here.